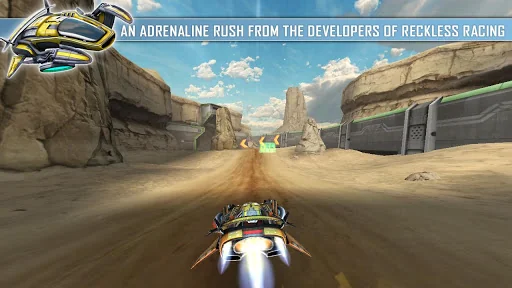
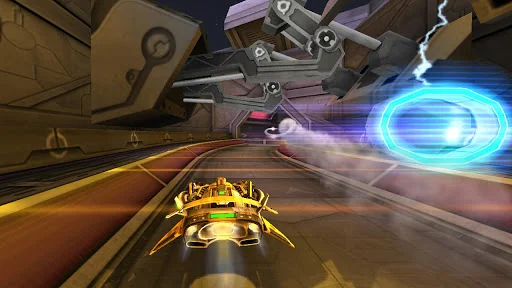
Get ready for a futuristic adrenaline rush!
This action racer puts you in the seat of experimental Repulze hovercraft working as a test pilot for the Man. Well, the Synthetic Man is more accurate. The Synthetics run the corporations. The corporations run the world. You are way down the food chain getting pushed around to complete their “scientific” challenges. But you’ll show ‘em…
•Super-fluid racing action with stunning graphics.
•Quick-to-learn touch and tilt controls but challenging to…
This action racer puts you in the seat of experimental Repulze hovercraft working as a test pilot for the Man. Well, the Synthetic Man is more accurate. The Synthetics run the corporations. The corporations run the world. You are way down the food chain getting pushed around to complete their “scientific” challenges. But you’ll show ‘em…
•Super-fluid racing action with stunning graphics.
•Quick-to-learn touch and tilt controls but challenging to master.
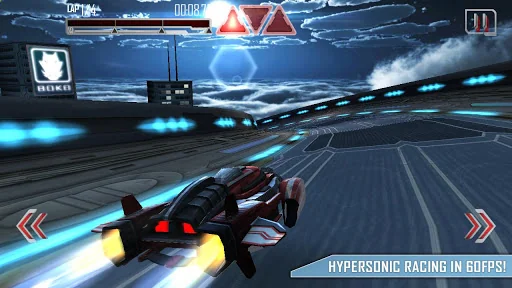
•7 hypersonic Repulze hovercraft.
•24 gravity defying tracks with lots of different challenges.
•Three game phases with varied play:
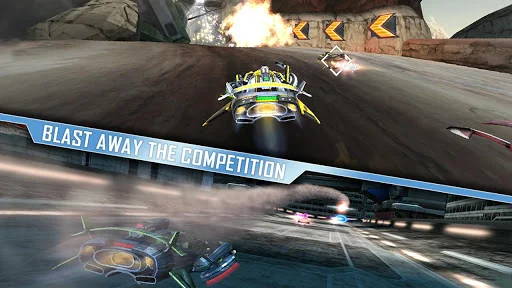
•Energy Gates, Magnets, Shortcuts, Ghosts, A.I. Opponents, Weapons and Combat.
•Online Leaderboards using Fuse Connect.
•Support for NVIDIA SHIELD and other devices with full HID game controllers.
•Xperia PLAY Optimized
•Features optional IAPs for players who want to unlock things faster.
•Languages: English, Deutsch, Français, Español, Italiano, 简体字, 日本語, 한국어, русский язык
Repulze is now MOGA Enhanced! Available at major retailers, carrier stores and online at http://www.MOGAanywhere.com
Comparable Android apps
The five apps in Racing with the closest revenue to Repulze. Click any to see its detail page.
Each forecast combines App Store rating, ratings count, monetisation model, pricing tier, IAP signals and ad-supported flag.
The base estimate is then multiplied by a per-category scaling factor learned from apps with founder-verified MRR.
Every number on this page comes from public APIs and bumetric's own snapshot history.
Full methodology covers input variables, accuracy bands per category and how we treat apps without comparable anchors.
See also the live data on Repulze's tracker page for current rating, reviews and snapshot timeline.
Building something similar? Get a free AI audit with $-revenue forecasts for every recommendation.
 Dr. Driving
 Traffic Racer
 CSR 2 Realistic Drag Racing
 Need for Speed™ No Limits
 Hill Climb Racing 2