Rest N Go – ASEAN's Largest Deployment of Vending Massage Chairs
Experience massage on-the-go with Rest N Go! We’ve got over 1,000 massage chair stations across Southeast Asia — ready for you, 24/7.
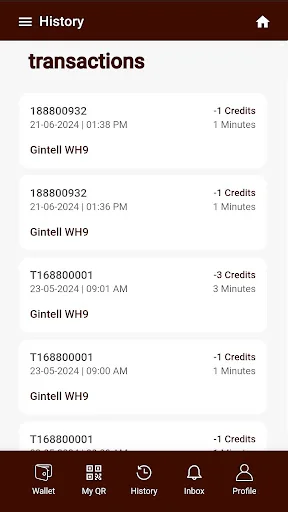
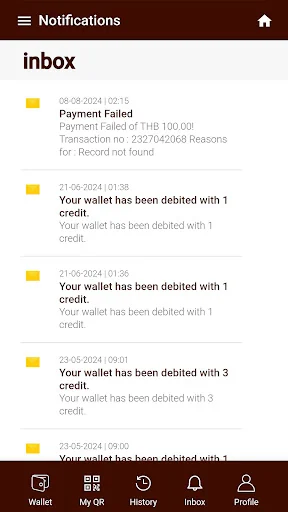
With just a simple SCAN, CLICK, and ENJOY, you can relax anytime, anywhere.
Key Features
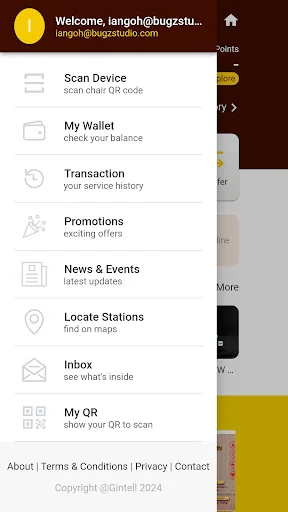
• Fast & Easy Sign-Up – Use email, Apple ID, or Google account
• Nearest Chair Locator – Find nearby Rest N Go stations instantly
• Multiple Payment Options – DuitNow, cash, or pay through …
Rest N Go – ASEAN's Largest Deployment of Vending Massage Chairs
Experience massage on-the-go with Rest N Go! We’ve got over 1,000 massage chair stations across Southeast Asia — ready for you, 24/7.
With just a simple SCAN, CLICK, and ENJOY, you can relax anytime, anywhere.
Key Features
• Fast & Easy Sign-Up – Use email, Apple ID, or Google account
• Nearest Chair Locator – Find nearby Rest N Go stations instantly
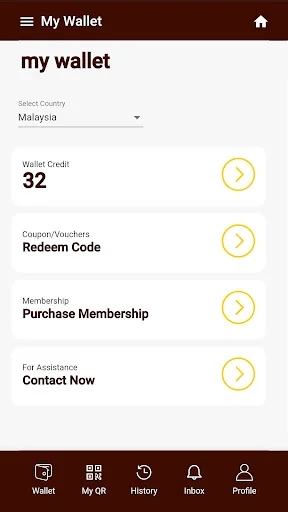
• Multiple Payment Options – DuitNow, cash, or pay through the app
• Rewards & Promos – Enjoy exclusive offers for app users
No bookings. No hassle. Just walk up, scan the QR code, and start your massage!
Relaxation has never been this easy.
Need help? Contact us at customer.service@restngoapp.com
Learn more: https://www.facebook.com/share/v/1Dn8giFCsu/
Comparable Android apps
The five apps in Health & Fitness with the closest revenue to Rest N Go. Click any to see its detail page.
Each forecast combines App Store rating, ratings count, monetisation model, pricing tier, IAP signals and ad-supported flag.
The base estimate is then multiplied by a per-category scaling factor learned from apps with founder-verified MRR.
Every number on this page comes from public APIs and bumetric's own snapshot history.
Full methodology covers input variables, accuracy bands per category and how we treat apps without comparable anchors.
See also the live data on Rest N Go's tracker page for current rating, reviews and snapshot timeline.
Building something similar? Get a free AI audit with $-revenue forecasts for every recommendation.

 Unidos Contra el Covid
 Weight Gain Diet Plan & Foods
 Be Well
 RDFit
RDFit
 Saisonkalender