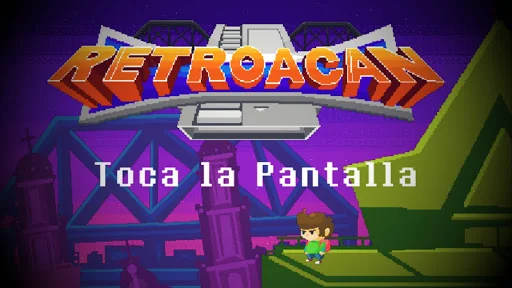
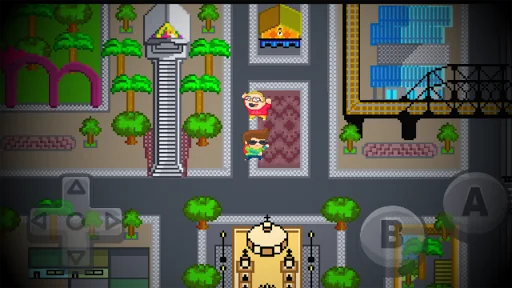
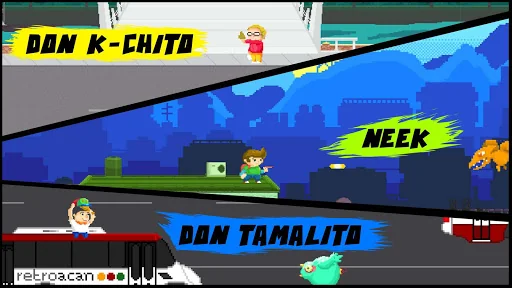
Retroacan is an action platformer game with an old school aesthetic. The whole city has been invaded by mysterious pixelated monsters, so it's up to Neek and his allies to save the day!
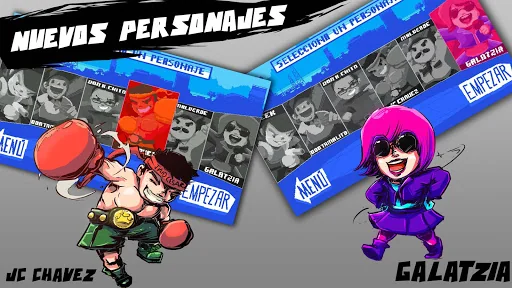
The story follows Neek, a young boy from Culiacán, Sinaloa. He goes to the market and buys an old video game from a mysterious man. When he tries to play it at home an entire army of strange creatures come out of it, invading the city. Now its up to him and some of the city’s celebrities to stop these retro-th…
Retroacan is an action platformer game with an old school aesthetic. The whole city has been invaded by mysterious pixelated monsters, so it's up to Neek and his allies to save the day!
The story follows Neek, a young boy from Culiacán, Sinaloa. He goes to the market and buys an old video game from a mysterious man. When he tries to play it at home an entire army of strange creatures come out of it, invading the city. Now its up to him and some of the city’s celebrities to stop these retro-themed monsters and save Culiacán!
Comparable Android apps
The five apps in Action with the closest revenue to Retroacan. Click any to see its detail page.
Each forecast combines App Store rating, ratings count, monetisation model, pricing tier, IAP signals and ad-supported flag.
The base estimate is then multiplied by a per-category scaling factor learned from apps with founder-verified MRR.
Every number on this page comes from public APIs and bumetric's own snapshot history.
Full methodology covers input variables, accuracy bands per category and how we treat apps without comparable anchors.
See also the live data on Retroacan's tracker page for current rating, reviews and snapshot timeline.
Building something similar? Get a free AI audit with $-revenue forecasts for every recommendation.
 Atlantis Invaders
 Snow Dudes
 War Heroes Shooter : Gun Games
 A WAY TO SMASH: Smart Fight
 Ice Hero Games: Superhero Game