Welcome to RipCharts - The industry leader in satellite fishing maps. This app is free to download for existing RipCharts Premium subscribers. If you are new to RipCharts, then we allow you to purchase a new RipCharts subscription via an In-App-Purchase. Please contact us if you have questions or would like a complementary demo. (http://www.ripcharts.com)
The RipCharts mobile app is a powerful tool that enables offshore fishermen to evaluate recent satellite imagery in order to determine favo…
Welcome to RipCharts - The industry leader in satellite fishing maps. This app is free to download for existing RipCharts Premium subscribers. If you are new to RipCharts, then we allow you to purchase a new RipCharts subscription via an In-App-Purchase. Please contact us if you have questions or would like a complementary demo. (http://www.ripcharts.com)
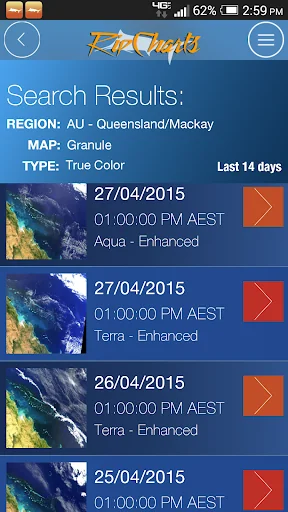
The RipCharts mobile app is a powerful tool that enables offshore fishermen to evaluate recent satellite imagery in order to determine favorable fishing conditions. Search for, view, and download maps of near-realtime satellite imagery onto your device to take with you offshore.
Map Features:
Use the multi-touch map to zoom, pan, view waypoints, and overlay additional data layers to gain insight into where the most favorable fishing zones are located.
Mapping Tools:
- Measure distances and headings between points
- Dynamically customize temp/color ranges on SST maps to identify subtle breaks <-- powerful feature!
- Overlay bathymetry, altimetry, currents, and Loran layers
- Tap the map to receive point information (lat, lon, depth, SST)
- Popular waypoints and fishing hotspots come pre-loaded
- Manage your personal waypoints (add,edit,delete)
- Save imagery to your device for offline/offshore use
- Show your position and navigate on saved imagery using GPS satellites
- "Go Here" navigation with bearing, ETA, and speed displays
- Floater oil rig positions updated twice daily (Gulf of Mexico only)
Comparable Android apps
The five apps in Sports with the closest revenue to RipCharts. Click any to see its detail page.
Each forecast combines App Store rating, ratings count, monetisation model, pricing tier, IAP signals and ad-supported flag.
The base estimate is then multiplied by a per-category scaling factor learned from apps with founder-verified MRR.
Every number on this page comes from public APIs and bumetric's own snapshot history.
Full methodology covers input variables, accuracy bands per category and how we treat apps without comparable anchors.
See also the live data on RipCharts's tracker page for current rating, reviews and snapshot timeline.
Building something similar? Get a free AI audit with $-revenue forecasts for every recommendation.





 20 Cones
 Partite in tv | Palinsesto
 Carrom Challenge: Multiplayer
 阪神Vデイリー
 GolfNow