Live screenshots from the App Store, captured by our snapshot worker. Tap any image to enlarge.
Robinhood helps you run your money your way. Identify trends for your investing strategies with technical indicators like moving average (MA), relative strength index (RSI), and more.
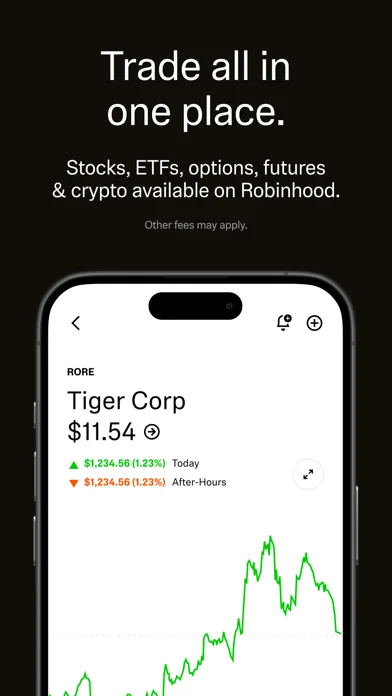
TRADING
-Commission-free trading on stocks, ETFs and their options
-Invest as much or as little as you want. Other fees may apply*
-Advanced trading tools - custom price alerts, advanced chards, and more
ROBINHOOD GOLD ($5/month)
-Earn 3.35% APY on uninvested cash (no cap)¹
-Get Instant Deposits up to $50,000²
-F…
Read full description →
Robinhood helps you run your money your way. Identify trends for your investing strategies with technical indicators like moving average (MA), relative strength index (RSI), and more.
TRADING
-Commission-free trading on stocks, ETFs and their options
-Invest as much or as little as you want. Other fees may apply*
-Advanced trading tools - custom price alerts, advanced chards, and more
ROBINHOOD GOLD ($5/month)
-Earn 3.35% APY on uninvested cash (no cap)¹
-Get Instant Deposits up to $50,000²
-First $1K of margin investing (if eligible)³
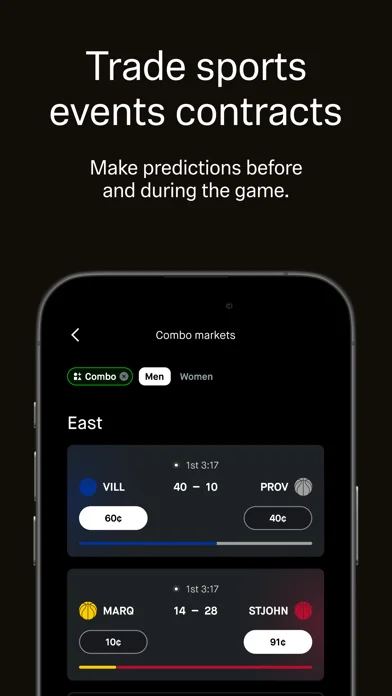
PREDICTION MARKETS
-Turn your insights into trades with event contracts on a regulated exchange
-The Robinhood Prediction Markets Hub features sports, politics, economics, and culture
-Build combo trades with different matchups, players, stats, and more
-Update your position at any time during the event
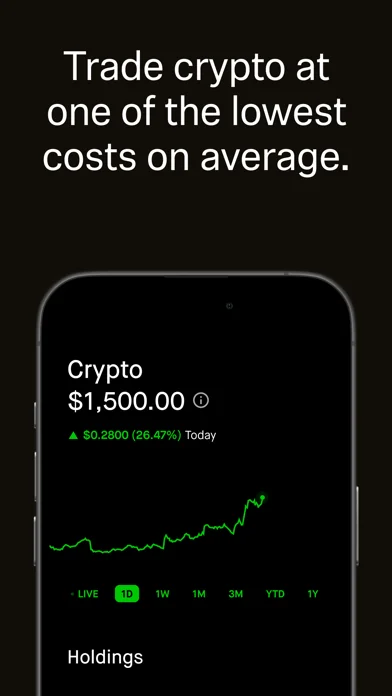
ROBINHOOD CRYPTO
-Trade crypto at one of the lowest costs on average
-Automate your crypto trades. Recurring buys for as little as $1
-45+ crypto assets available. Trade BTC, ETH, DOGE and more
-Transfer crypto with zero deposit or withdrawal fees
SECURITY + 24/7 LIVE SUPPORT
-Chat with a Robinhood associate anytime
-Security tools, like 2-factor authentication
Disclosures
Investing is risky, consider investment objectives & risks carefully before investing
*View Robinhood Financial's fee schedule at rbnhd.co/fees
Trading and owning digital assets involves significant risk, including the risk of substantial loss. Cryptocurrency services are offered through an account with Robinhood Crypto, LLC (NMLS ID 1702840). Robinhood Crypto is licensed to engage in virtual currency business activity by the New York State Department of Financial Services. Cryptocurrency held through Robinhood Crypto is not FDIC insured or SIPC protected
Fractional shares are illiquid outside of Robinhood & are not transferable. Not all securities are eligible for fractional share orders. Learn more at robinhood.com
Robinhood Gold is a subscription-based membership program of premium services offered through Robinhood Gold, LLC
Securities trading offered through Robinhood Financial LLC, member SIPC. See our Customer Relationship Summary at rbnhd.co/crs
Portfolio management offered through Robinhood Asset Management, LLC (“Robinhood Strategies” or “RAM”), an SEC-registered investment advisor For additional information about Robinhood Strategies, including about services, fees, risks, and conflicts of interest, please find our firm’s brochure at adviserinfo.sec.gov
Robinhood Financial LLC, Robinhood Gold, LLC, Robinhood Crypto, LLC, and Robinhood Asset Management, LLC are wholly-owned subsidiaries of Robinhood Markets, Inc
Futures, options on futures, and cleared swaps trading involves significant risk and is not appropriate for everyone. Please carefully consider if it's appropriate for you in light of your personal financial circumstances. Futures, options on futures and cleared swaps trading is offered by Robinhood Derivatives, LLC, a registered futures commission merchant with the Commodity Futures Trading Commission (CFTC) and Member of National Futures Association (NFA)
Not all investors will be eligible to trade on Margin. Margin investing involves the risk of greater investment losses. Additional interest charges may apply depending on the amount of margin used. Rates subject to change.
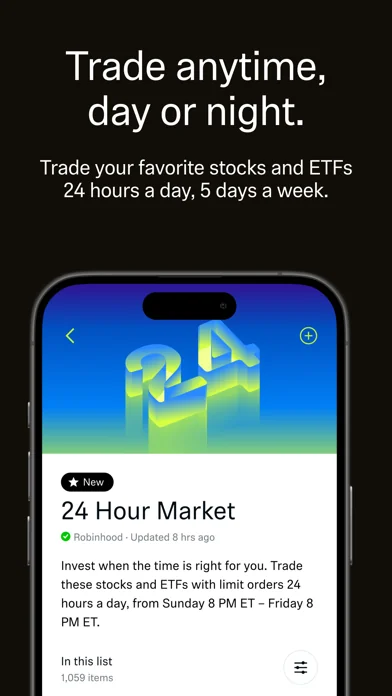
There are additional, unique risks with trading outside of regular market hours you should be aware of before making an investment decision, including the risk of lower liquidity, increased volatility, greater spreads, and pricing uncertainty. Robinhood 24 Hour Market is from Sunday 8 PM ET - Friday 8 PM ET
Robinhood, 85 Willow Road, Menlo Park, CA 94025
The five apps in Finance with the closest revenue to Robinhood Trading & Investing. Click any to see its detail page.
Each forecast combines App Store rating, ratings count, monetisation model, pricing tier, IAP signals and ad-supported flag.
The base estimate is then multiplied by a per-category scaling factor learned from apps with founder-verified MRR.
Every number on this page comes from public APIs and bumetric's own snapshot history.

 Tonkeeper — TON Wallet
 Expenses OK - expenses tracker
 GEICO Mobile - Car Insurance
 HomeBudget with Sync
 Cashinator – Ausgaben teilen