What Rugged Rovers actually does (from store listing)
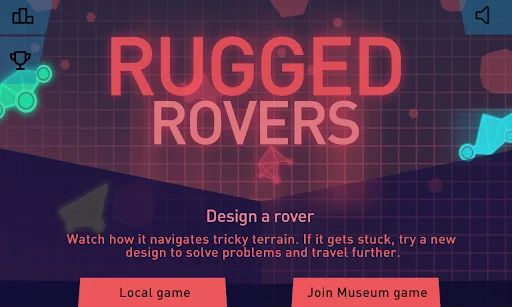
Design and test your own all-terrain space rover! Race against rivals (including friends!) as you jump gaping canyons and cross treacherous boulder fields. Go as far as you can and try to be the top rover!
Rugged Rovers, from the Science Museum in London, UK, features:
- Now you can RACE AGAINST FRIENDS in your network!
- New HIGH SCORES and ACHIEVEMENTS!
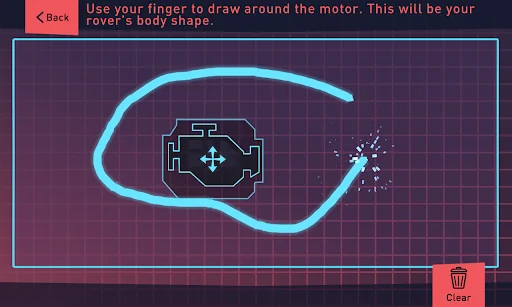
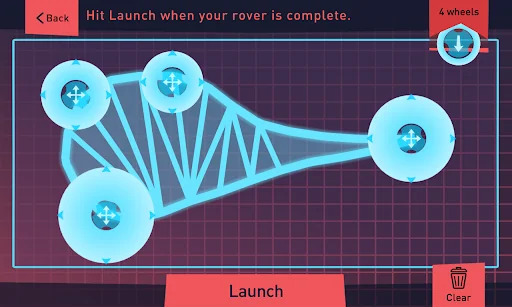
- Easy rover drawing tools, including movable motor and resizable wheels
- Dramatic Mars-inspired space…
Design and test your own all-terrain space rover! Race against rivals (including friends!) as you jump gaping canyons and cross treacherous boulder fields. Go as far as you can and try to be the top rover!
Rugged Rovers, from the Science Museum in London, UK, features:
- Now you can RACE AGAINST FRIENDS in your network!
- New HIGH SCORES and ACHIEVEMENTS!
- Easy rover drawing tools, including movable motor and resizable wheels
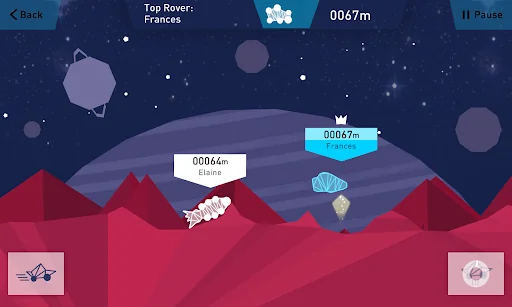
- Dramatic Mars-inspired spacescape to test your rovers to the max
- Jet hover and speed boost to help your rover overcome terrain obstacles
- Top tips about how to solve common rover challenges
Your rover will be up against weird and wonderful designs some by your friends and some by real-life Mars rover engineer Abbie Hutty. Can your designs beat the professionals at their own game?
Play Rugged Rovers anywhere on your mobile or come to the Science Museum’s cutting-edge exhibition Engineer Your Future to play against your friends on our BIG screen.
Find out more about becoming an engineer: sciencemuseum.org.uk/engineeryourfuture
Comparable Android apps
The five apps in Racing with the closest revenue to Rugged Rovers. Click any to see its detail page.
Each forecast combines App Store rating, ratings count, monetisation model, pricing tier, IAP signals and ad-supported flag.
The base estimate is then multiplied by a per-category scaling factor learned from apps with founder-verified MRR.
Every number on this page comes from public APIs and bumetric's own snapshot history.
Full methodology covers input variables, accuracy bands per category and how we treat apps without comparable anchors.
See also the live data on Rugged Rovers's tracker page for current rating, reviews and snapshot timeline.
Building something similar? Get a free AI audit with $-revenue forecasts for every recommendation.

 Jurassic Race
 Bad Roads
 Mega Ramp Bike Stunts Games 3D
 HAJWALH LINE
 Death Moto