What RyderDrive actually does (from store listing)
With RyderDrive, we are revolutionizing the way we record and communicate the massive amounts of data that are shared between our drivers, location managers, Ryder hubs, customers, and regulating agencies every day. By automating and digitizing this information, RyderDrive enables higher accuracy of data while driving efficiency in our operations, as well as improving the experience for our drivers.
The app enables all driver centric communication around dispatch, in-transit collaboration, de…
With RyderDrive, we are revolutionizing the way we record and communicate the massive amounts of data that are shared between our drivers, location managers, Ryder hubs, customers, and regulating agencies every day. By automating and digitizing this information, RyderDrive enables higher accuracy of data while driving efficiency in our operations, as well as improving the experience for our drivers.
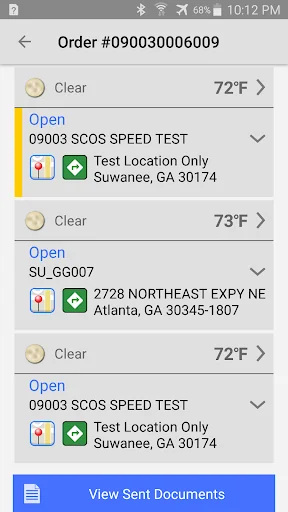
The app enables all driver centric communication around dispatch, in-transit collaboration, delivery execution, and trip completion. In addition to driver communication, RyderDrive allows for document management critical to the driver for seamless communication to the operations.
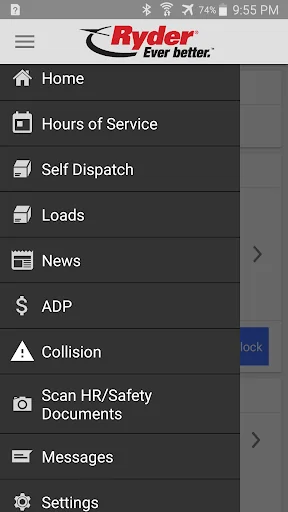
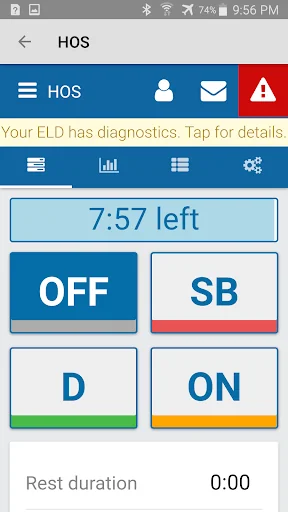
With RyderDrive, drivers will be able to utilize the mobile application to build efficiencies around trip management and driver workflow with features that are crucial in complying with the Electronic Logging Device (ELD) Mandate. The RyderDrive features include;
- Hours of Service Recording
- Digital Trip Management
- Document capture
- Driver Payroll
- NewsFeed
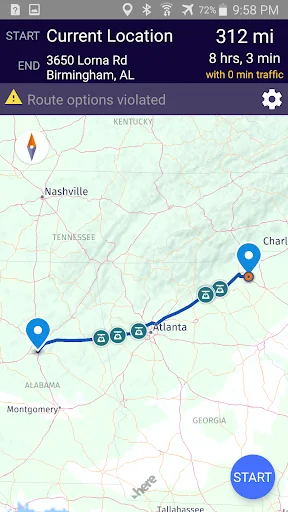
- Trip Navigation
- Messaging
- Electronic Driver Vehicle Inspection Report
Comparable Android apps
The five apps in Business with the closest revenue to RyderDrive. Click any to see its detail page.
Each forecast combines App Store rating, ratings count, monetisation model, pricing tier, IAP signals and ad-supported flag.
The base estimate is then multiplied by a per-category scaling factor learned from apps with founder-verified MRR.
Every number on this page comes from public APIs and bumetric's own snapshot history.
Full methodology covers input variables, accuracy bands per category and how we treat apps without comparable anchors.
See also the live data on RyderDrive's tracker page for current rating, reviews and snapshot timeline.
Building something similar? Get a free AI audit with $-revenue forecasts for every recommendation.

 HRM Mobile
 ezguard
 Cezanne HR for Mobile
 idenfit
 Szamlazz.hu - Invoicing App