S-mobiili combines retail, banking and asset management services into one app.
You can activate the app with any bank’s credentials or a mobile certificate.
For more information about using or activating S-mobiili, tap the bubble in the top right corner of the app or go to https://www.s-kanava.fi/palvelut/s-mobiili/.
What can I do in S-mobiili?
Member services
Bonus and Purchases – Track the Bonus status of your household and check how close you are to the next Bonus level. …
S-mobiili combines retail, banking and asset management services into one app.
You can activate the app with any bank’s credentials or a mobile certificate.
For more information about using or activating S-mobiili, tap the bubble in the top right corner of the app or go to https://www.s-kanava.fi/palvelut/s-mobiili/.
What can I do in S-mobiili?
Member services
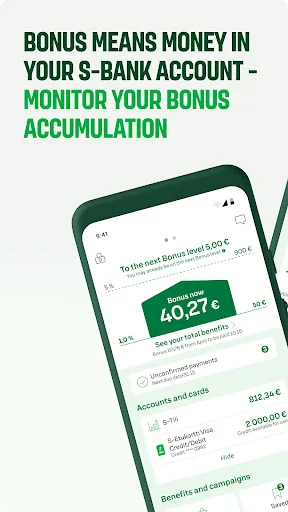
Bonus and Purchases – Track the Bonus status of your household and check how close you are to the next Bonus level. Review the breakdown of your purchases into different product groups, the degree of Finnish origin of your shopping basket, and compare price levels with competitors.
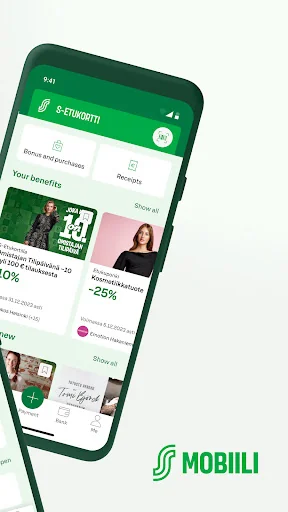
S-Etukortti and S-Etukortti barcode – Earn Bonus and take advantage of co-op member benefits with your phone.
Benefits and tips – Benefits tailored to you and current news. Note: By enabling notifications, you can make sure you’re always informed about your latest benefits.
Receipts for your purchases – Receipts for your purchases will be stored in the electronic receipt archive and you can stop receiving unnecessary paper receipts.
Your favourite outlets – Easily find benefits, promotions, opening hours and services for your favourite outlets in one place.
Where to earn Bonus – Search or browse locations in your area where you can earn Bonus
My information and information of your co-op member household – Easily manage your contact information and the information of your co-op member household
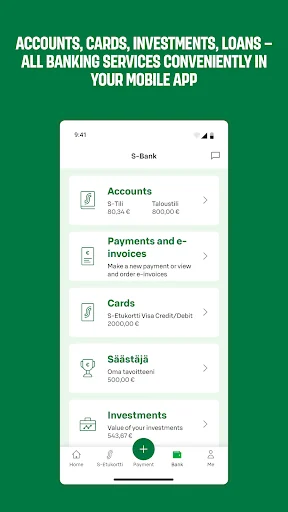
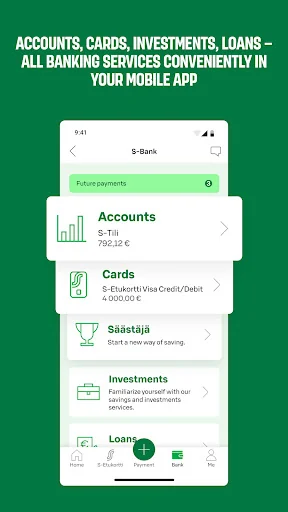
Bank services
Authentication – Log in and pay with your personal PIN code or fingerprint instead of using banking credentials – also works for online stores and public services!
Saver – Achieve easy savings as part of your everyday spending. Save one euro for every card payment or transfer the Bonuses you get for your S Group purchases to a fund.
Investments – Check your funds or investments, make additional investments in the funds you own, or invest in new funds.
Loans – Apply for an S-Laina loan or increase the loan amount, and check your loan information.
Accounts – View your account balances and transactions.
E-salary – View electronic payslips.
Cards – Apply for a new card or increase your card’s credit limit. Check the PIN code of your card, adjust security limits, and view your credit transactions.
Google Pay – Connect your payment card to the Google Pay app to start making mobile payments.
Paying – Pay bills or transfer money between your accounts easily and quickly.
E-invoices - Order new e-invoices and view your existing e-invoice orders.
S-Bank Private – Make use of investment and asset management services tailored to your needs. Only available to S-Bank Private customers.
Contact us – Call us or send us a message, provide feedback on our services, or view our FAQs.
Please note that in order to use S-mobiili, you must be a co-op member or belong to a co-op member household. More information about co-op membership: s-kanava.fi
What does S-mobiili request permission to?
Location data, so that we can provide you with the closest services and the most relevant benefits.
Use of the camera, to scan barcodes so you can conveniently pay your bills.
Sending notifications, so that you can be notified of matters like received e-invoices and electronic cash receipts.
Comparable Android apps
The five apps in Finance with the closest revenue to S-mobiili. Click any to see its detail page.
Each forecast combines App Store rating, ratings count, monetisation model, pricing tier, IAP signals and ad-supported flag.
The base estimate is then multiplied by a per-category scaling factor learned from apps with founder-verified MRR.
Every number on this page comes from public APIs and bumetric's own snapshot history.
Full methodology covers input variables, accuracy bands per category and how we treat apps without comparable anchors.
See also the live data on S-mobiili's tracker page for current rating, reviews and snapshot timeline.
Building something similar? Get a free AI audit with $-revenue forecasts for every recommendation.

 comdirect
 Cathay CUBE Rewards
 Todito
 Hang Seng Personal Banking
 LIC Agent App