Sakenowa is an app for keeping track of all the sake you've drunk and enjoying as much as possible.
== Record Your Sake Consumption ==
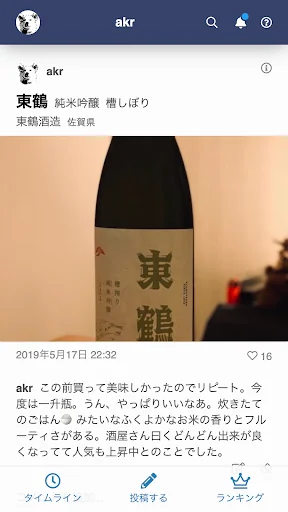
You can keep track of the sake you drink with easy to use controls. Include photos and shops. You'll never forget.
== Learn More About Sake ==
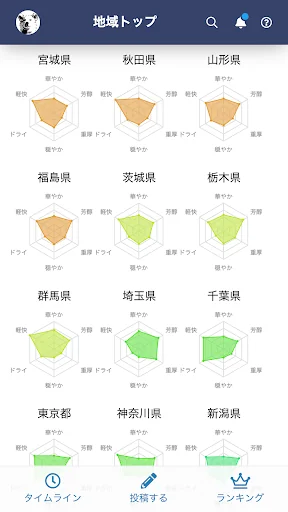
You can find a variety of information about sake, such as flavors and aromas using our unique flavor identification system, as well as articles related to the brand name.
== Find Your Favorite Sake ==
You can e…
Sakenowa is an app for keeping track of all the sake you've drunk and enjoying as much as possible.
== Record Your Sake Consumption ==
You can keep track of the sake you drink with easy to use controls. Include photos and shops. You'll never forget.
== Learn More About Sake ==
You can find a variety of information about sake, such as flavors and aromas using our unique flavor identification system, as well as articles related to the brand name.
== Find Your Favorite Sake ==
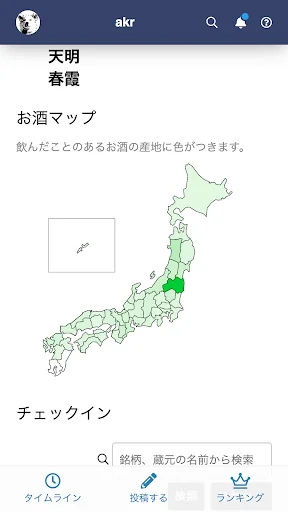
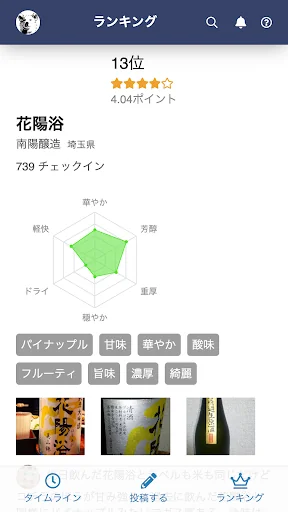
You can even find the sake of your choice by looking at the comments on the timeline. Based on the taste, aroma, and characteristics of the sake you like, we will make some more recommendations.
A web version is also available at https://sakenowa.com
Comparable Android apps
The five apps in Food & Drink with the closest revenue to Sakenowa. Click any to see its detail page.
Each forecast combines App Store rating, ratings count, monetisation model, pricing tier, IAP signals and ad-supported flag.
The base estimate is then multiplied by a per-category scaling factor learned from apps with founder-verified MRR.
Every number on this page comes from public APIs and bumetric's own snapshot history.
Full methodology covers input variables, accuracy bands per category and how we treat apps without comparable anchors.
See also the live data on Sakenowa's tracker page for current rating, reviews and snapshot timeline.
Building something similar? Get a free AI audit with $-revenue forecasts for every recommendation.

 Hooters - Ordering and Rewards
 Baydoner Cossla: Yemek Sipariş
 Sultan's Dine
 Cat&Foods
 Cheezious