What Sandbox 3D actually does (from store listing)
Sandbox 3D is an open-world physical sandbox where you can manipulate various objects and experiment with physics with your friends.
<b> Features :
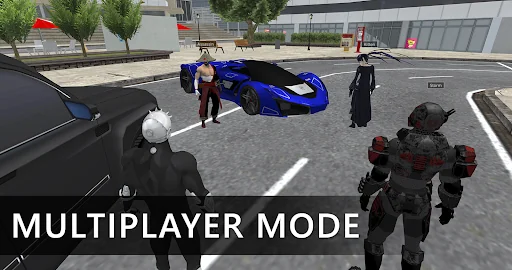
- Multiplayer
- Free world
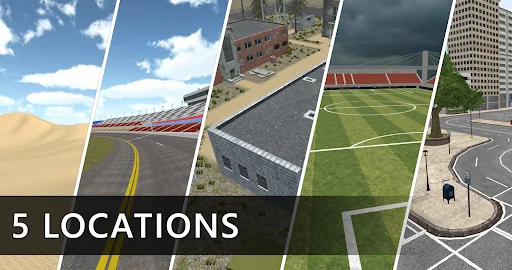
- 5 locations: Desert, Speedway, Military Base, Football Field, Modern City.
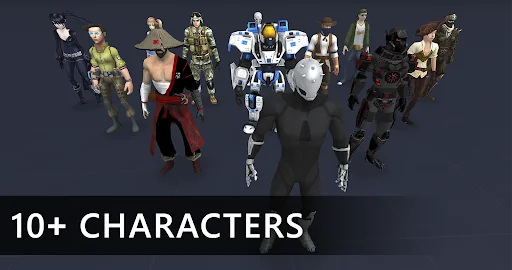
- 10+ characters
- 10+ vehicles (land and air)
- 150+ items in inventory
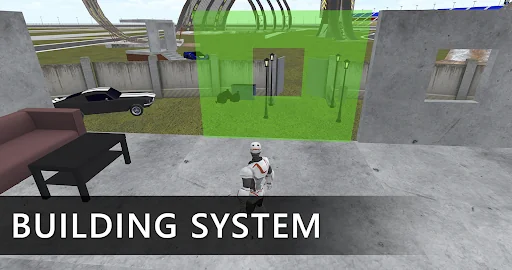
- Building system
- 2 modes: Public and private mode.
● In public mode, everyone can create and delete not only their objects, but also others. In this case, the c…
Sandbox 3D is an open-world physical sandbox where you can manipulate various objects and experiment with physics with your friends.
Features :
- Multiplayer
- Free world
- 5 locations: Desert, Speedway, Military Base, Football Field, Modern City.
- 10+ characters
- 10+ vehicles (land and air)
- 150+ items in inventory
- Building system
- 2 modes: Public and private mode.
● In public mode, everyone can create and delete not only their objects, but also others. In this case, the creator of the server can block access to create or delete objects on the server.
● In private mode, everyone can create objects, but only their owners can delete them. When you exit the server, all objects created by the player are deleted. The server owner cannot block access to creating and deleting objects, nor can he delete them himself.
Suggestions for improving the game and bug reports you can left on our forum: https://forum.catsbit.com/
Comparable Android apps
The five apps in Simulation with the closest revenue to Sandbox 3D. Click any to see its detail page.
Each forecast combines App Store rating, ratings count, monetisation model, pricing tier, IAP signals and ad-supported flag.
The base estimate is then multiplied by a per-category scaling factor learned from apps with founder-verified MRR.
Every number on this page comes from public APIs and bumetric's own snapshot history.
Full methodology covers input variables, accuracy bands per category and how we treat apps without comparable anchors.
See also the live data on Sandbox 3D's tracker page for current rating, reviews and snapshot timeline.
Building something similar? Get a free AI audit with $-revenue forecasts for every recommendation.

 Clicker Racing
 Monster Story by TeamLava™
 Dragon Tamer
 IDBS Truck Trailer
 My Hospital: Doctor Game