The official app for Samsung Developer Conference 2019 is a must-have to navigate this year’s event. In an effort to be eco-friendly, this app will replace printed agendas onsite.
With this app, you will be able to:
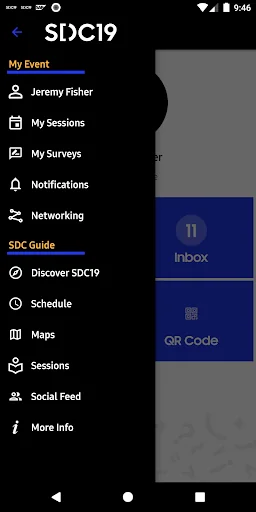
- Access conference information at your fingertips
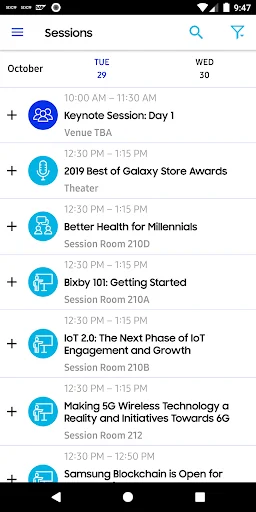
- Manage your favorite sessions
- Access session locations and speaker information
- View an interactive conference map
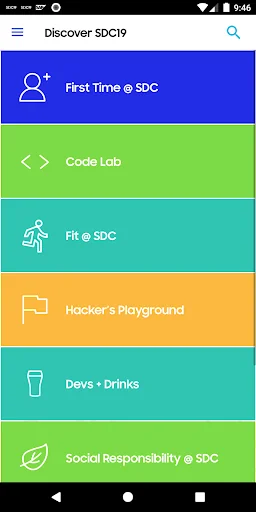
- Learn about Exhibits, Activities, and Code Lab
- Receive important event announcements via push noti…
The official app for Samsung Developer Conference 2019 is a must-have to navigate this year’s event. In an effort to be eco-friendly, this app will replace printed agendas onsite.
With this app, you will be able to:
- Access conference information at your fingertips
- Manage your favorite sessions
- Access session locations and speaker information
- View an interactive conference map
- Learn about Exhibits, Activities, and Code Lab
- Receive important event announcements via push notifications
- And more!
Join us at SDC19, October 29–30 at the San Jose Convention Center. Learn more about the conference at http://developer.samsung.com/sdc
Comparable Android apps
The five apps in Business with the closest revenue to SDC19. Click any to see its detail page.
Each forecast combines App Store rating, ratings count, monetisation model, pricing tier, IAP signals and ad-supported flag.
The base estimate is then multiplied by a per-category scaling factor learned from apps with founder-verified MRR.
Every number on this page comes from public APIs and bumetric's own snapshot history.
Full methodology covers input variables, accuracy bands per category and how we treat apps without comparable anchors.
See also the live data on SDC19's tracker page for current rating, reviews and snapshot timeline.
Building something similar? Get a free AI audit with $-revenue forecasts for every recommendation.

 مشوار | MSHWAR
 Freshchat
 My Tata Technologies
 TI SFA
 eÚčtenka EET pokladna