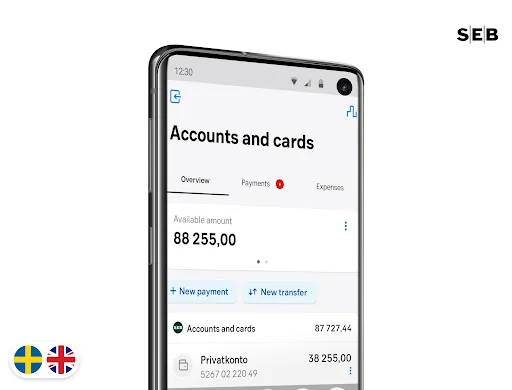
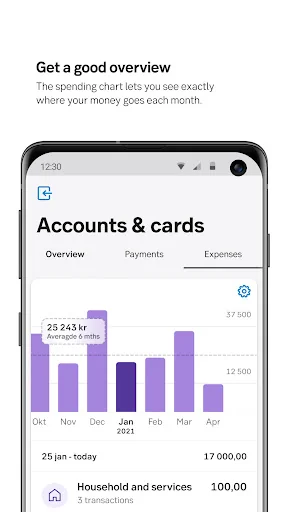
The app is designed for our private customers. Using the app, you’ll always be in control of your finances and can quickly transfer money, pay invoices and see upcoming transactions. You’ll receive notifications of new e-invoices and can easily scan paper invoices with your mobile camera. Your purchases are automatically categorised, so you can always check where your money is being spent.
Examples of services:
• Pay invoices by scanning the OCR number, amount and recipient with the mobile ca…
The app is designed for our private customers. Using the app, you’ll always be in control of your finances and can quickly transfer money, pay invoices and see upcoming transactions. You’ll receive notifications of new e-invoices and can easily scan paper invoices with your mobile camera. Your purchases are automatically categorised, so you can always check where your money is being spent.
Examples of services:
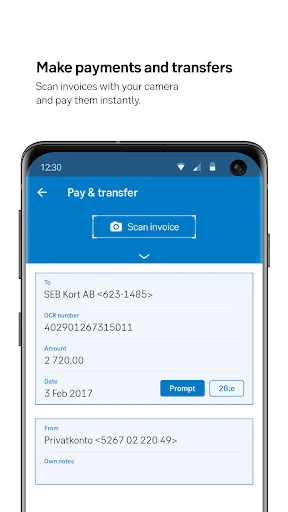
• Pay invoices by scanning the OCR number, amount and recipient with the mobile camera
• Make immediate transfers between your own accounts using drag and drop
• Search your account history 36 months back in time
• See unbilled purchases and the latest charge and credit card invoice
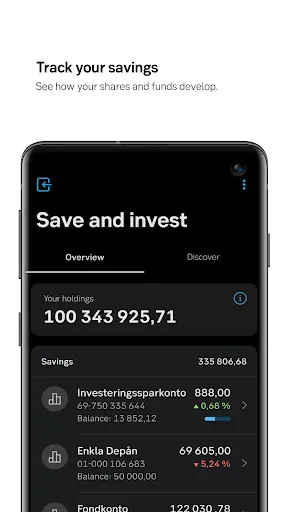
• Trade funds and securities in your fund account and investment savings account
• Follow the development of several types of pension savings and insurances
• See your loans and information about your next loan payment
• Get control of your balance using the chart that shows progress over time
• Estimate your savings and set personal savings goals
• Use the currency converter to convert amounts to the most common currencies
• Find your nearest branch or ATM
• Use the expense chart to see where your money is being spent
Receive notifications of new e-invoices and transactions in your account
Tools for Enkla firman: Monitor important dates for, among other things, VAT instalments and declarations of income
Our app for private individuals is made especially for customers of internet banking for private individuals or Enkla firman. Login using Mobile BankID on the same device or using a digipass. To use Mobile BankID you need a Swedish personal identity number and the BankID app. Apply for Mobile BankID online.
Comparable Android apps
The five apps in Finance with the closest revenue to SEB. Click any to see its detail page.
Each forecast combines App Store rating, ratings count, monetisation model, pricing tier, IAP signals and ad-supported flag.
The base estimate is then multiplied by a per-category scaling factor learned from apps with founder-verified MRR.
Every number on this page comes from public APIs and Bumetric's own snapshot history.
Full methodology covers input variables, accuracy bands per category and how we treat apps without comparable anchors.
See also the live data on SEB's tracker page for current rating, reviews and snapshot timeline.
Building something similar? Get a free AI audit with $-revenue forecasts for every recommendation.


 KFH Online
 Suncoast SunMobile
 CoinMarketCap: Crypto Tracker
 Aqua credit card
 Central Bank