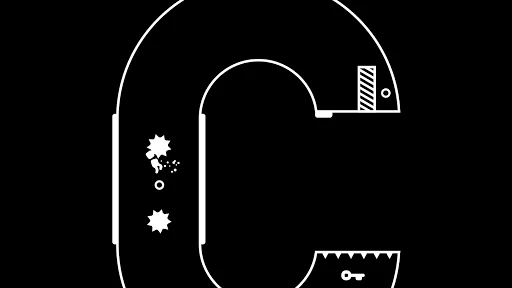
Never before did a mobile platformer feel so juicy – perfect controls for super precise speed runs in over 150 levels. Prepare to chop, impale and crush your character in pursuit of the last coin of every level.
· · · · · · · · ·
+ Google Play Indie Games Showcase 2019: Best 10 games
+ German computer game prize: Best mobile game 2019
+ toucharcade.com: "one you don’t want to miss" – game of the week
+ pocketgamer.com: "brutal and elegant modern classic" – 4.5/5
+ metro.co.uk: "fabulou…
Never before did a mobile platformer feel so juicy – perfect controls for super precise speed runs in over 150 levels. Prepare to chop, impale and crush your character in pursuit of the last coin of every level.
· · · · · · · · ·
+ Google Play Indie Games Showcase 2019: Best 10 games
+ German computer game prize: Best mobile game 2019
+ toucharcade.com: "one you don’t want to miss" – game of the week
+ pocketgamer.com: "brutal and elegant modern classic" – 4.5/5
+ metro.co.uk: "fabulously clever and addictive"
+ mobilesyrup.com: "excellently made platform"
+ prettymuchgeeks.com: "superbly complex" – 9/10
+ appolicious.com: 9.5/10
Comparable Android apps
The five apps in Action with the closest revenue to see/saw. Click any to see its detail page.
Each forecast combines App Store rating, ratings count, monetisation model, pricing tier, IAP signals and ad-supported flag.
The base estimate is then multiplied by a per-category scaling factor learned from apps with founder-verified MRR.
Every number on this page comes from public APIs and bumetric's own snapshot history.
Full methodology covers input variables, accuracy bands per category and how we treat apps without comparable anchors.
See also the live data on see/saw's tracker page for current rating, reviews and snapshot timeline.
Building something similar? Get a free AI audit with $-revenue forecasts for every recommendation.


 Mortal Kombat
 Hunter Assassin
 Runic Curse
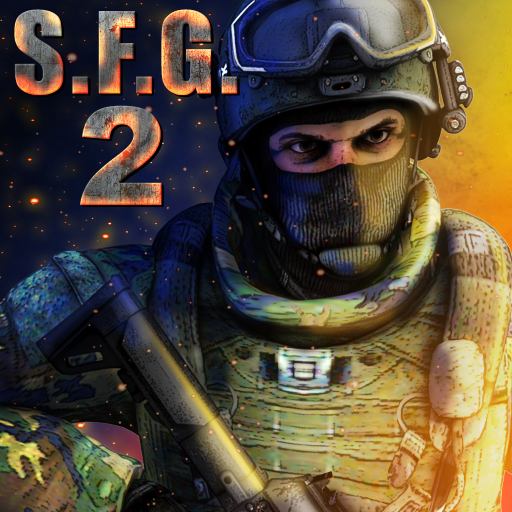 Special Forces Group 2
 Retro City Rampage DX