What SensorPush actually does (from store listing)
SensorPush is the easiest way to monitor the environmental conditions affecting the things you care about. Quickly pair the app with our Humidity & Temperature Smart Sensors (available at http://www.sensorpush.com/buy) and enjoy the sleek interface for viewing current and past conditions. Add the SensorPush G1 WiFi Gateway for easy access to your data from anywhere, using our included cloud service.
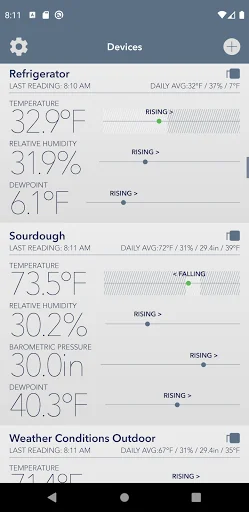
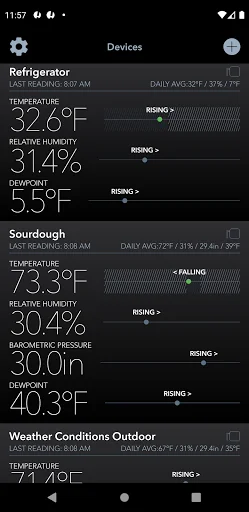
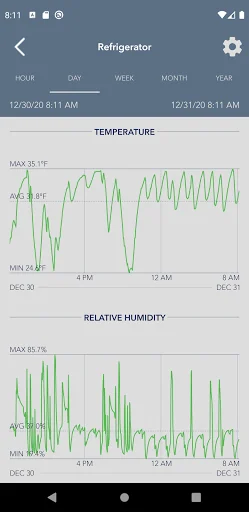
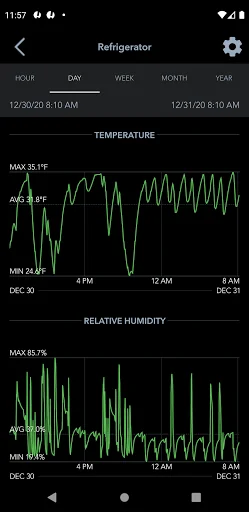
In addition to the elegant current conditions and time series displays, the distribution views…
SensorPush is the easiest way to monitor the environmental conditions affecting the things you care about. Quickly pair the app with our Humidity & Temperature Smart Sensors (available at http://www.sensorpush.com/buy) and enjoy the sleek interface for viewing current and past conditions. Add the SensorPush G1 WiFi Gateway for easy access to your data from anywhere, using our included cloud service.
In addition to the elegant current conditions and time series displays, the distribution views give you instant insight into what temperature and humidity levels are most prevalent in a location and what the extremes were for the previous hour, day, week, month, or year.
Of course, as much as you care about your home, musical instruments, family heirlooms, art or wine collections and other prized possessions, you don't need yet another chore: continually monitoring their thermometer and hygrometer readings. This is why we created a streamlined interface to configure desired conditions and enable alerts.
With the drag of a slider you can set the optimal range for any situation, whether it's a greenhouse or your guitar. Then when your Android device is within range of the sensor (300+ feet line of sight), it will be continuously monitoring conditions.
Even when you're away, the Smart Sensor will continue to monitor conditions and upon your return the data will be seamlessly pushed to your Android device which will notify you of problematic conditions so you can take action.
Love data? Export your entire history to CSV for analysis with virtually any spreadsheet or data application.
Try SensorPush today and protect yourself from moldy basements and attics, cracked and damaged musical instruments, ruined family keepsakes and other costly and frustrating mishaps caused by inappropriate temperature and moisture levels.
Comparable Android apps
The five apps in Lifestyle with the closest revenue to SensorPush. Click any to see its detail page.
Each forecast combines App Store rating, ratings count, monetisation model, pricing tier, IAP signals and ad-supported flag.
The base estimate is then multiplied by a per-category scaling factor learned from apps with founder-verified MRR.
Every number on this page comes from public APIs and bumetric's own snapshot history.
Full methodology covers input variables, accuracy bands per category and how we treat apps without comparable anchors.
See also the live data on SensorPush's tracker page for current rating, reviews and snapshot timeline.
Building something similar? Get a free AI audit with $-revenue forecasts for every recommendation.

 헤이홈 Hejhome
 Minibig
 Real Plans - Meal Planner
 Only For You
 NotiEasy - Save Notification