With Sharjah Electricity, Water and Gas Authority (SEWA) Mobile App, available in Arabic and English, you can now take full control of your account. The SEWA app, you can simplify your utility management with our intuitive and user-friendly mobile app, putting all your account information at your fingertips. Discover a range of new features designed to enhance your experience and keep you in complete control. From self-meter reading to usage monitoring & compare, the SEWA app has everything you …
With Sharjah Electricity, Water and Gas Authority (SEWA) Mobile App, available in Arabic and English, you can now take full control of your account. The SEWA app, you can simplify your utility management with our intuitive and user-friendly mobile app, putting all your account information at your fingertips. Discover a range of new features designed to enhance your experience and keep you in complete control. From self-meter reading to usage monitoring & compare, the SEWA app has everything you need in one convenient place.
Key Features:
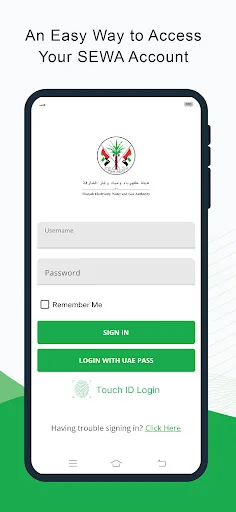
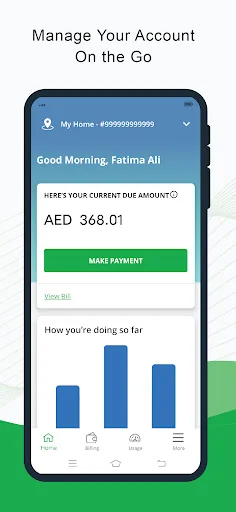
• Manage your account anytime, anywhere!
• Hassle free login with UAE Pass & face ID
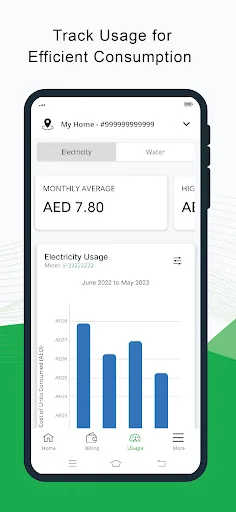
• Stay informed about your utility consumption with intuitive graphs for better decision-making.
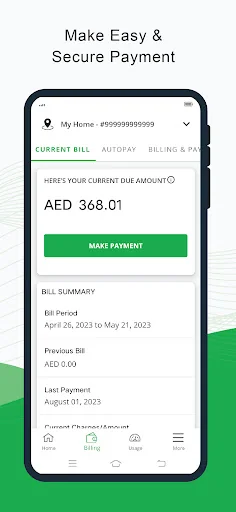
• Make secure bill payments, set up auto payment and check billing & payment history effortlessly.
• Easily analyse your monthly usage patterns
• Receive important notifications on your preferred channel.
Download the SEWA app today and unlock a world of convenience and control over your utility account. Simplify your life and make smarter decisions with ease.
Comparable Android apps
The five apps in Business with the closest revenue to SEWA. Click any to see its detail page.
Each forecast combines App Store rating, ratings count, monetisation model, pricing tier, IAP signals and ad-supported flag.
The base estimate is then multiplied by a per-category scaling factor learned from apps with founder-verified MRR.
Every number on this page comes from public APIs and bumetric's own snapshot history.
Full methodology covers input variables, accuracy bands per category and how we treat apps without comparable anchors.
See also the live data on SEWA's tracker page for current rating, reviews and snapshot timeline.
Building something similar? Get a free AI audit with $-revenue forecasts for every recommendation.

 Abfall-App STL
 PlentyONE POS
 Capango: Job Search Simplified
 Axisrooms CM (Old)
 Animal Nexus 365 - Digital Liv