Discover the Sharaf DG App: Your Ultimate Shopping Destination
Welcome to a world of smart, secure, and seamless shopping. Sharaf DG, the most trusted electronics store across GCC and MENA, is here to revolutionize your shopping experience. Designed with your convenience in mind, our mobile app serves as a one-stop solution for all your electronics needs, making it ideal for you and your family.
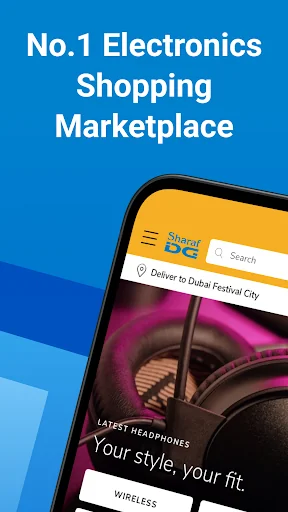
Stay Ahead with the Latest Tech:
Be the first to know about real-time product launches, excl…
Discover the Sharaf DG App: Your Ultimate Shopping Destination
Welcome to a world of smart, secure, and seamless shopping. Sharaf DG, the most trusted electronics store across GCC and MENA, is here to revolutionize your shopping experience. Designed with your convenience in mind, our mobile app serves as a one-stop solution for all your electronics needs, making it ideal for you and your family.
Stay Ahead with the Latest Tech:
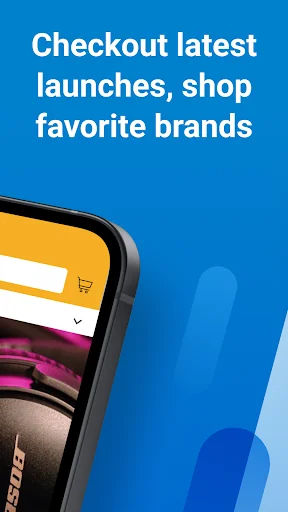
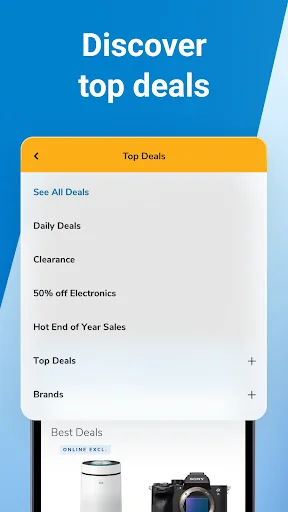
Be the first to know about real-time product launches, exclusive offers, and trending deals. Explore the most extensive selection of electronics, from world-renowned tech brands to local favorites—all at your fingertips.
Omnichannel Shopping Redefined:
Effortlessly locate the nearest Sharaf DG store and check product availability in seconds. Whether you prefer shopping online or in-store, our integrated experience gives you the flexibility to shop your way.
Secure and Convenient Transactions:
Enjoy peace of mind with our secure payment options, including Credit/Debit Cards, Apple Pay, Cash on Delivery, and flexible payment plans like Buy Now, Pay Later. Choose fast doorstep delivery or convenient in-store pickup for a truly tailored shopping experience.
Tailored for You and Your Family:
Take advantage of exclusive deals and promotions designed to meet your unique needs. With bilingual support in Arabic and English, our user-friendly app makes browsing, comparing, and buying electronics easy for everyone.
Why Choose the Sharaf DG App?
• Supports Arabic and English for a seamless shopping experience.
• Stay updated with instant notifications about new arrivals and trending
products.
• Offers a variety of payment options, including installment plans.
• Provides exclusive discounts and personalized deals.
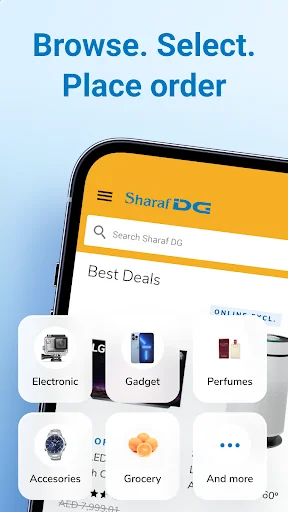
• Features a user-friendly design for effortless browsing, product comparison, and customer reviews.
Join thousands of families who trust Sharaf DG for their technology needs. Download the app today and experience the ultimate in smart shopping!
Comparable Android apps
The five apps in Shopping with the closest revenue to Sharaf DG. Click any to see its detail page.
Each forecast combines App Store rating, ratings count, monetisation model, pricing tier, IAP signals and ad-supported flag.
The base estimate is then multiplied by a per-category scaling factor learned from apps with founder-verified MRR.
Every number on this page comes from public APIs and bumetric's own snapshot history.
Full methodology covers input variables, accuracy bands per category and how we treat apps without comparable anchors.
See also the live data on Sharaf DG's tracker page for current rating, reviews and snapshot timeline.
Building something similar? Get a free AI audit with $-revenue forecasts for every recommendation.

 MySPAR – Neked kedvez!
 Shopini
 Ef Butik
 NL Store
 KSL Classifieds