What Shareworks actually does (from store listing)
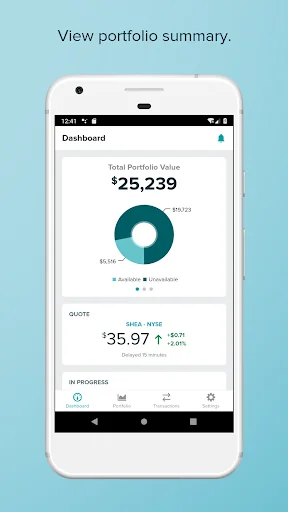
View your portfolio, upcoming events and complete transaction history. Sell or transfer shares and exercise options.
You'll need a Shareworks account to use the app. To activate your account, visit https://shareworks.solium.com/activate.
WATCH IT GROW:
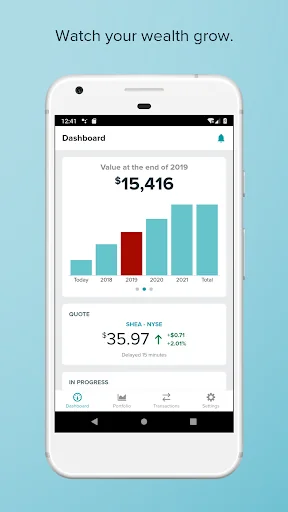
• Manage and forecast your portfolio
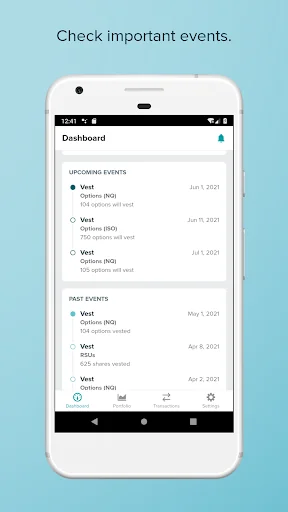
• Track important events, both past and future
• View employee stock purchase plan holdings
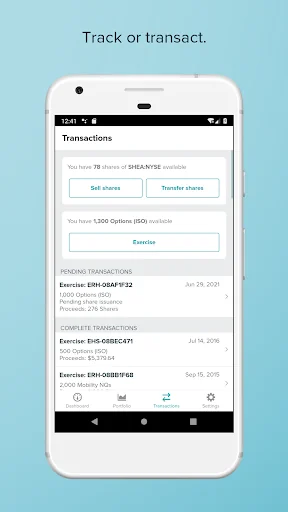
TRANSACT:
• Sell or transfer shares
• Exercise options
• Select an action when restricted stock awards …
View your portfolio, upcoming events and complete transaction history. Sell or transfer shares and exercise options.
You'll need a Shareworks account to use the app. To activate your account, visit https://shareworks.solium.com/activate.
WATCH IT GROW:
• Manage and forecast your portfolio
• Track important events, both past and future
• View employee stock purchase plan holdings
TRANSACT:
• Sell or transfer shares
• Exercise options
• Select an action when restricted stock awards vest
• View your transaction history
SAFE AND SECURE:
• Sign in securely via fingerprint (for Android 6.0+ on supported hardware)
• All communication is encrypted
• No financial data is stored on the device
Comparable Android apps
The five apps in Finance with the closest revenue to Shareworks. Click any to see its detail page.
Each forecast combines App Store rating, ratings count, monetisation model, pricing tier, IAP signals and ad-supported flag.
The base estimate is then multiplied by a per-category scaling factor learned from apps with founder-verified MRR.
Every number on this page comes from public APIs and bumetric's own snapshot history.
Full methodology covers input variables, accuracy bands per category and how we treat apps without comparable anchors.
See also the live data on Shareworks's tracker page for current rating, reviews and snapshot timeline.
Building something similar? Get a free AI audit with $-revenue forecasts for every recommendation.

 DenizMobile
 FEE Mobile
 Lollands Bank
 AL5 AMAGGI
 Tricard - Para sua Loja