No No stuffy! ?
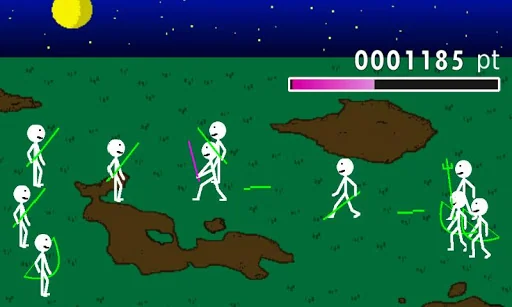
Came today! From left to right, we aim at the life of the samurai bounty hunter! !
Be in the bow and arrow bamboo basket, is also strong in the mess to a sword! !
Samurai be manipulated by tapping the screen!
"Oh! Or not to avoid the attack of Sessha!"
"Wacho do not! ..."
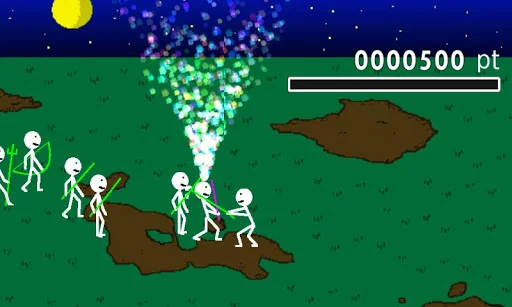
Samurai keep fighting...
"Numerical superiority is a bamboo basket · · · a cowardly people"
Samurai battle does not end.
[How to play]
Samurai sword wielding proceeds to the direc…
No No stuffy! ?
Came today! From left to right, we aim at the life of the samurai bounty hunter! !
Be in the bow and arrow bamboo basket, is also strong in the mess to a sword! !
Samurai be manipulated by tapping the screen!
"Oh! Or not to avoid the attack of Sessha!"
"Wacho do not! ..."
Samurai keep fighting...
"Numerical superiority is a bamboo basket · · · a cowardly people"
Samurai battle does not end.
[How to play]
Samurai sword wielding proceeds to the direction that you tap!
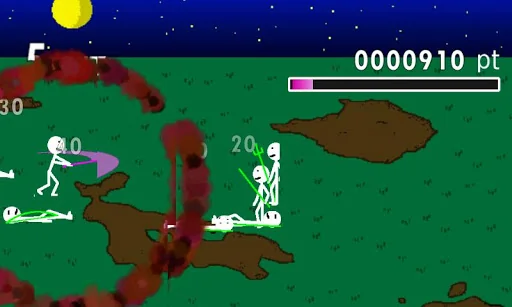
From the front and go toward, bamboo basket, so be careful fend off enemy well!
Game Over When there are no physical strength at the top!
Comparable Android apps
The five apps in Casual with the closest revenue to Shingeki. Click any to see its detail page.
Each forecast combines App Store rating, ratings count, monetisation model, pricing tier, IAP signals and ad-supported flag.
The base estimate is then multiplied by a per-category scaling factor learned from apps with founder-verified MRR.
Every number on this page comes from public APIs and bumetric's own snapshot history.
Full methodology covers input variables, accuracy bands per category and how we treat apps without comparable anchors.
See also the live data on Shingeki's tracker page for current rating, reviews and snapshot timeline.
Building something similar? Get a free AI audit with $-revenue forecasts for every recommendation.


 As Aventuras do Anjo Téo
 Crazy HotDog Maker Cooking
 Pink Gothic Fashion Style
 Today opening hamburger Schopp
 Pumpkin Carver