What Shiny Chain actually does (from store listing)
With this application you will be able to take control of your shiny chain in an intuitive and effective way. It shows diverse data, very useful in your adventure, such as percentage of shinys, ivs and hidden ability, in each stage of the chain. Share your hunts with your friends!
FEATURES
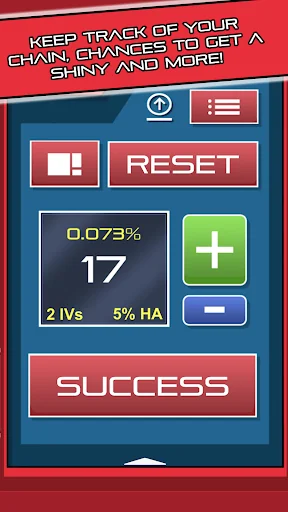
● Single counter to keep track of your shiny chain in Sun and Moon.
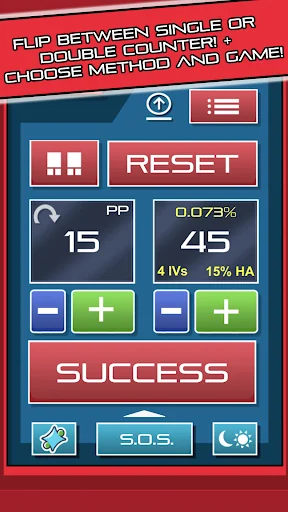
● Double counter, if you also want to record how many PP has the opponent spent already. You will be able to know how many they have lef…
With this application you will be able to take control of your shiny chain in an intuitive and effective way. It shows diverse data, very useful in your adventure, such as percentage of shinys, ivs and hidden ability, in each stage of the chain. Share your hunts with your friends!
FEATURES
● Single counter to keep track of your shiny chain in Sun and Moon.
● Double counter, if you also want to record how many PP has the opponent spent already. You will be able to know how many they have left. Prevent your enemy from using struggle and an unexpected end of the chain!
● Useful data:
- % shiny
- % hidden ability
- minimum maxIVs
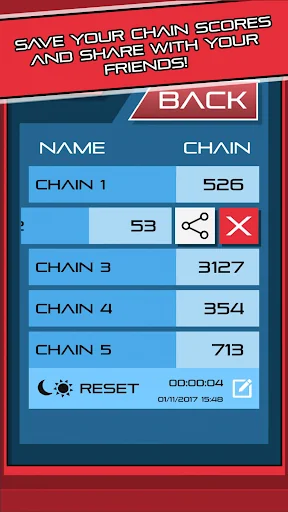
● Save the chain information when you are done to keep track of your achievements.
● Languages: English, Spanish, German, Chinese, Japanese, Italian, Portuguese, French, Korean.
PRO VERSION
● Game editions: Let's Go, Ultra Sun & Moon, Sun & Moon, Alpha & Omega, X & Y, Black & White.
● No ads.
● Register as many chains as you want.
● Choose method, game edition and shiny charm option to customize the percentages in each case.
★Twitter: https://twitter.com/ShinyChain
Comparable Android apps
The five apps in Tools with the closest revenue to Shiny Chain. Click any to see its detail page.
Each forecast combines App Store rating, ratings count, monetisation model, pricing tier, IAP signals and ad-supported flag.
The base estimate is then multiplied by a per-category scaling factor learned from apps with founder-verified MRR.
Every number on this page comes from public APIs and bumetric's own snapshot history.
Full methodology covers input variables, accuracy bands per category and how we treat apps without comparable anchors.
See also the live data on Shiny Chain's tracker page for current rating, reviews and snapshot timeline.
Building something similar? Get a free AI audit with $-revenue forecasts for every recommendation.

 Discount Calculator
 Bluetooth Settings
 TruckTracer
 Bulk Rename File
 IBackup