What Simply Save actually does (from store listing)
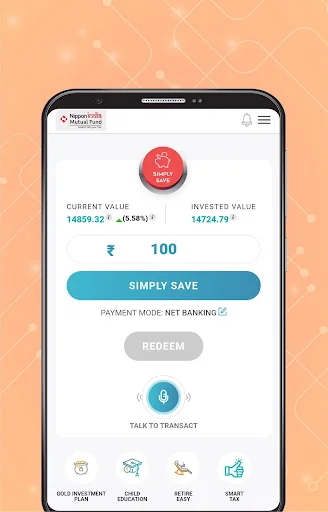
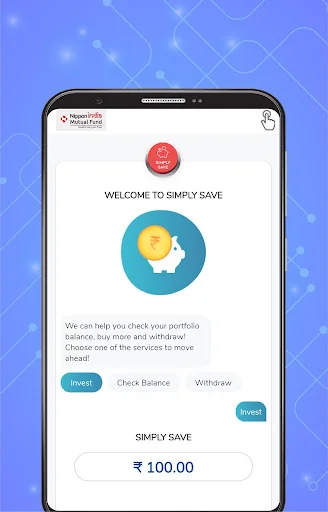
The Simply Save App from Nippon India Mutual Fund offers a straightforward and convenient way to cultivate a habit of investing in mutual funds. With just a click, you can invest your idle cash effortlessly.
Key Features:
1.One click Investment: Click on Simply Save button each time you want to save or invest
2.Convenient: Saving money with ‘Simply Save’ is very convenient, no matter where you, you can save money instantly.
3.Low Risk: Your money is invested in Nippon India Liquid …
The Simply Save App from Nippon India Mutual Fund offers a straightforward and convenient way to cultivate a habit of investing in mutual funds. With just a click, you can invest your idle cash effortlessly.
Key Features:
1.One click Investment: Click on Simply Save button each time you want to save or invest
2.Convenient: Saving money with ‘Simply Save’ is very convenient, no matter where you, you can save money instantly.
3.Low Risk: Your money is invested in Nippon India Liquid Fund - Growth Plan- Growth Option, which invests in Debt and Money Market Instruments, which are relatively low risk.
4.Easy Payment Option: Choose from pre-registered debit mandates, debit cards, or net banking for payments. For the best experience, we recommend using a pre-registered mandate (consult your financial advisor for assistance).
Start your journey towards financial wellness today!
Comparable Android apps
The five apps in Finance with the closest revenue to Simply Save. Click any to see its detail page.
Each forecast combines App Store rating, ratings count, monetisation model, pricing tier, IAP signals and ad-supported flag.
The base estimate is then multiplied by a per-category scaling factor learned from apps with founder-verified MRR.
Every number on this page comes from public APIs and bumetric's own snapshot history.
Full methodology covers input variables, accuracy bands per category and how we treat apps without comparable anchors.
See also the live data on Simply Save's tracker page for current rating, reviews and snapshot timeline.
Building something similar? Get a free AI audit with $-revenue forecasts for every recommendation.



 UniCredit mBanking
 Exchange rate. All currencies
 나이스지키미
 Oney : suivez vos achats
 allianceonline Mobile