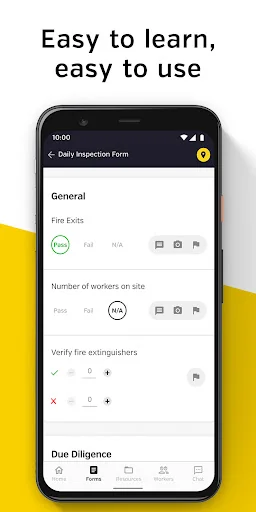
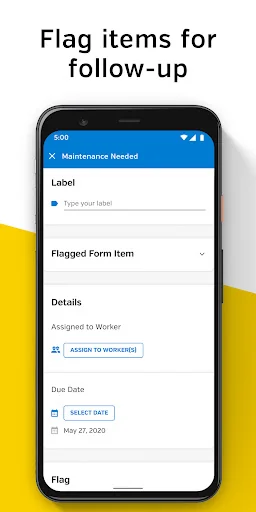
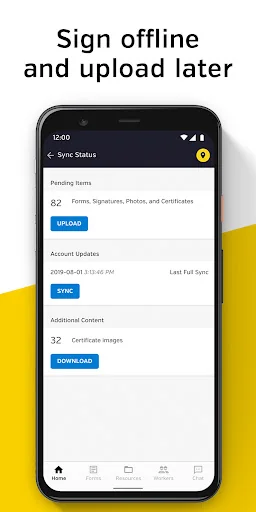
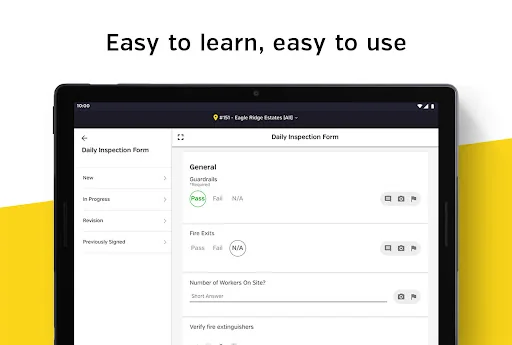
It’s difficult to maintain a safe workplace using paper or inadequate software. SiteDocs Safety Management Software helps companies streamline operations with digital forms, ensure compliance with real-time monitoring, and reduce injuries with advanced analytics. This makes safety compliance easier for everyone, saving time, money, and lives.
By going paperless with SiteDocs, you can attain the highest level of safety and make your company more profitable by eliminating hundreds of hours was…
It’s difficult to maintain a safe workplace using paper or inadequate software. SiteDocs Safety Management Software helps companies streamline operations with digital forms, ensure compliance with real-time monitoring, and reduce injuries with advanced analytics. This makes safety compliance easier for everyone, saving time, money, and lives.
By going paperless with SiteDocs, you can attain the highest level of safety and make your company more profitable by eliminating hundreds of hours wasted handling paper. With real-time monitoring and accountability not only will you save time and money, you’ll also ensure compliance and improve safety culture across all your job sites.
Comparable Android apps
The five apps in Business with the closest revenue to SiteDocs. Click any to see its detail page.
Each forecast combines App Store rating, ratings count, monetisation model, pricing tier, IAP signals and ad-supported flag.
The base estimate is then multiplied by a per-category scaling factor learned from apps with founder-verified MRR.
Every number on this page comes from public APIs and bumetric's own snapshot history.
Full methodology covers input variables, accuracy bands per category and how we treat apps without comparable anchors.
See also the live data on SiteDocs's tracker page for current rating, reviews and snapshot timeline.
Building something similar? Get a free AI audit with $-revenue forecasts for every recommendation.


 Oracle Cloud Infrastructure
 Marshall ClubCard
 PCPortal
 VeriScan - ID Scanner
 PalmOrder: Pre-selling