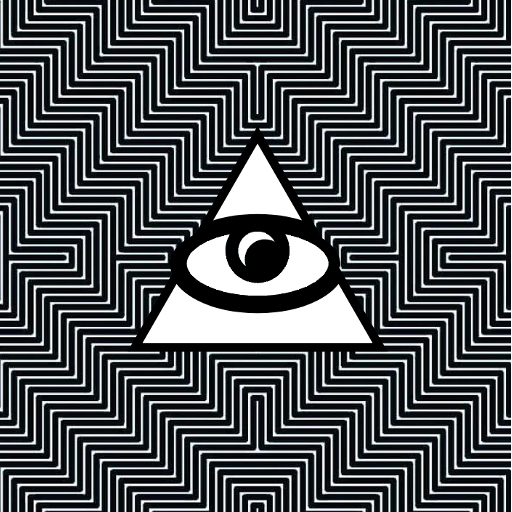
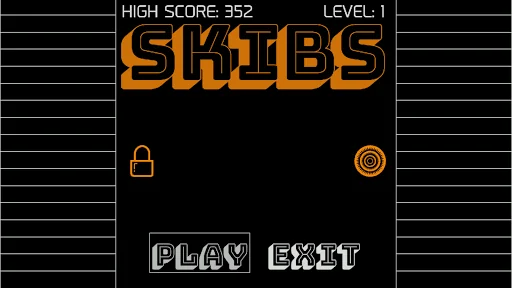
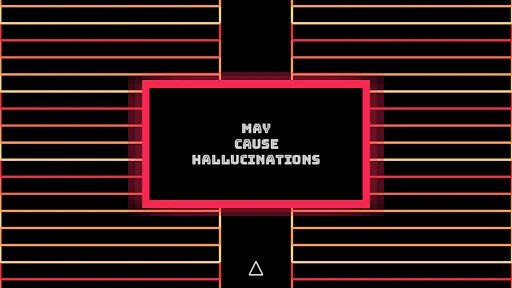
Skibs is a minimalistic, psychedelic, infinite runner. Navigate down the endless multicolored wormhole, surviving the skibs, these "power ups" that cause anomalies and try to kill you. If you can live long enough, you just might see some things, as this game is designed to explicitly cause visual illusions within skilled players.
Skibs is a unique game in that it uses geometric art to induce a motion aftereffect. Many video games of today use ultra realistic graphics to envelope players in fa…
Skibs is a minimalistic, psychedelic, infinite runner. Navigate down the endless multicolored wormhole, surviving the skibs, these "power ups" that cause anomalies and try to kill you. If you can live long enough, you just might see some things, as this game is designed to explicitly cause visual illusions within skilled players.
Skibs is a unique game in that it uses geometric art to induce a motion aftereffect. Many video games of today use ultra realistic graphics to envelope players in fantasy worlds that seem like they could be real. Skibs on the other hand does more with less, giving players the option to visually enhance the real world around them.
Play if you dare!
Purchase on PC: https://heinousgames.itch.io/skibs
Purchase on iOS: https://itunes.apple.com/us/app/skibs/id1445242267?mt=8
Comparable Android apps
The five apps in Arcade with the closest revenue to Skibs. Click any to see its detail page.
Each forecast combines App Store rating, ratings count, monetisation model, pricing tier, IAP signals and ad-supported flag.
The base estimate is then multiplied by a per-category scaling factor learned from apps with founder-verified MRR.
Every number on this page comes from public APIs and bumetric's own snapshot history.
Full methodology covers input variables, accuracy bands per category and how we treat apps without comparable anchors.
See also the live data on Skibs's tracker page for current rating, reviews and snapshot timeline.
Building something similar? Get a free AI audit with $-revenue forecasts for every recommendation.
 Dumb Knuckle: Ways to Survive
 Rebound Invaders From Space
 Zombie Goes Up
 Platformer
 Fox and Raccoon