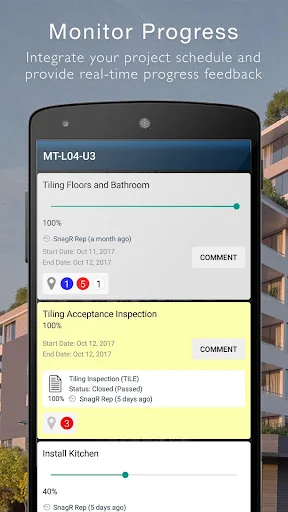
SnagR is designed to monitor the progress of complex projects, providing the easiest way to capture field data, automate reporting and visualise sophisticated analytics. Generate and get access to real-time progress information as you move around the site during inspection.
The result is a fast and efficient way of dealing with snagging and inspections.
Main Features:
* Location Plotting (visual approach using plans, elevations, photos and PDFs)
* Defect Management (comprehensive su…
SnagR is designed to monitor the progress of complex projects, providing the easiest way to capture field data, automate reporting and visualise sophisticated analytics. Generate and get access to real-time progress information as you move around the site during inspection.
The result is a fast and efficient way of dealing with snagging and inspections.
Main Features:
* Location Plotting (visual approach using plans, elevations, photos and PDFs)
* Defect Management (comprehensive suite)
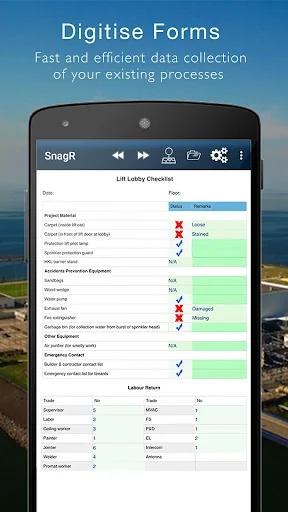
* Site Inspections (Room data sheets, progress monitor, company standards and recurring)
* Professional Reports (email and print services)
* Mobile Document Repository (reference project drawings on phones and tablets)
* Sync to project websites using wifi or 3G
* Multi Lingual versions available in Arabic, Chinese, Portuguese and other languages
* Used by Main contractors, Sub Contractors, CoWs, Consultants – configurable to individual users
* All project data is fully configurable by Project Staff
* Full audit trails showing author and date-time
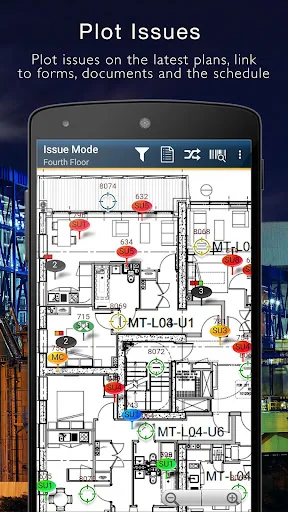
snagR offers a simple and accessible way of plotting work using visual symbols in exact locations of the construction site. Symbols, descriptions, assignments, photos (with markup), due by dates, signatures and attached documents are used to accurately define the work that has been done or needs to be done.
This plot shows the task reference code, the concerned project members, the task priority and most importantly its location.
Comparable Android apps
The five apps in Business with the closest revenue to SnagR. Click any to see its detail page.
Each forecast combines App Store rating, ratings count, monetisation model, pricing tier, IAP signals and ad-supported flag.
The base estimate is then multiplied by a per-category scaling factor learned from apps with founder-verified MRR.
Every number on this page comes from public APIs and bumetric's own snapshot history.
Full methodology covers input variables, accuracy bands per category and how we treat apps without comparable anchors.
See also the live data on SnagR's tracker page for current rating, reviews and snapshot timeline.
Building something similar? Get a free AI audit with $-revenue forecasts for every recommendation.


 My Subaru
 The Archer
 Bahi Khata - Udhaari Solution
 Salvador Eyewear
 يمن سداد