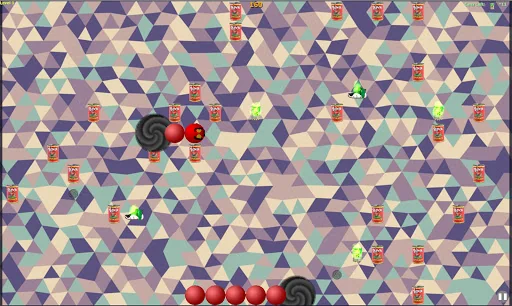
Toxic Snavenger rides again. Grab up those toxic treats and stinky sneakers, while avoiding obnoxious health food.
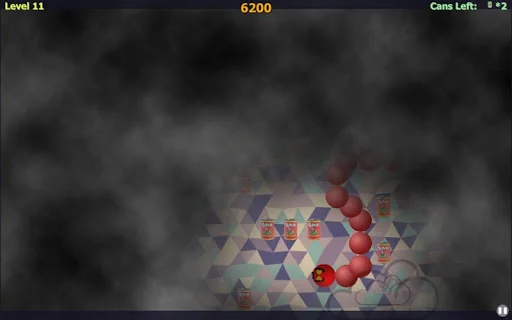
Beware the wormhole. The shortest path isn't always the safest (and not always a straight line.) Mysteries await you!
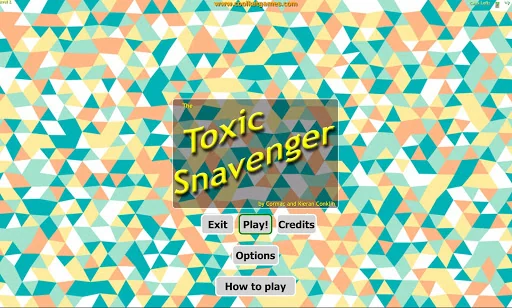
Snavenger is back with more points, more strategy, more platforms and more ways to get killed. All new scoring opportunities mean the only way to get BIG POINTS is a delicate balancing act of speed, shortest paths and choices. Are you ready to take on the …
Toxic Snavenger rides again. Grab up those toxic treats and stinky sneakers, while avoiding obnoxious health food.
Beware the wormhole. The shortest path isn't always the safest (and not always a straight line.) Mysteries await you!
Snavenger is back with more points, more strategy, more platforms and more ways to get killed. All new scoring opportunities mean the only way to get BIG POINTS is a delicate balancing act of speed, shortest paths and choices. Are you ready to take on the world?
Follow the world high score competition at www.snavenger.com and compete to be World's Best, adding a competitive twist to a classic snake game
Comparable Android apps
The five apps in Arcade with the closest revenue to Snavenger. Click any to see its detail page.
Each forecast combines App Store rating, ratings count, monetisation model, pricing tier, IAP signals and ad-supported flag.
The base estimate is then multiplied by a per-category scaling factor learned from apps with founder-verified MRR.
Every number on this page comes from public APIs and bumetric's own snapshot history.
Full methodology covers input variables, accuracy bands per category and how we treat apps without comparable anchors.
See also the live data on Snavenger's tracker page for current rating, reviews and snapshot timeline.
Building something similar? Get a free AI audit with $-revenue forecasts for every recommendation.


 Jewel Switch Crush
 Mysterious Creatures
 Coulrophobia
 Toss a coin
 Sector