What Snellen Chart actually does (from store listing)
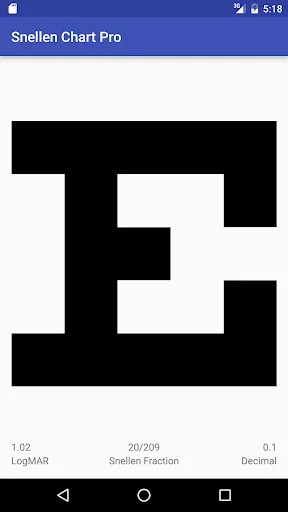
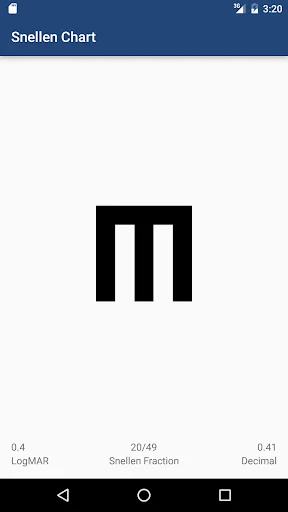
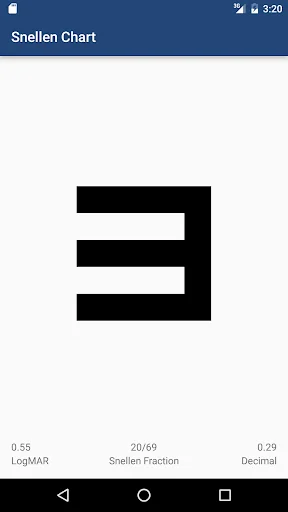
This mHealth application intent is to provide and empower mobile regular users and health professionals with the tool with which they can estimate their or others visual acuity, based on a classical Snellen Chart Test. This App is innovative because it transforms an old style poster test design in a new, modern, intuitive, ubiquitous test. One App with a simple user interface, and an intuitive navigation chart using swipe gestures to navigate from optotype to optotype, and with the capability to…
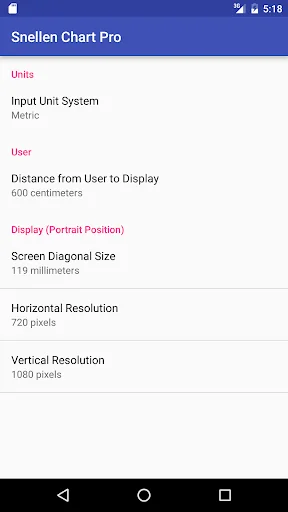
This mHealth application intent is to provide and empower mobile regular users and health professionals with the tool with which they can estimate their or others visual acuity, based on a classical Snellen Chart Test. This App is innovative because it transforms an old style poster test design in a new, modern, intuitive, ubiquitous test. One App with a simple user interface, and an intuitive navigation chart using swipe gestures to navigate from optotype to optotype, and with the capability to adapt the Snellen Chart Test to different screen sizes, screen resolutions and user distances.
Comparable Android apps
The five apps in Medical with the closest revenue to Snellen Chart. Click any to see its detail page.
Each forecast combines App Store rating, ratings count, monetisation model, pricing tier, IAP signals and ad-supported flag.
The base estimate is then multiplied by a per-category scaling factor learned from apps with founder-verified MRR.
Every number on this page comes from public APIs and bumetric's own snapshot history.
Full methodology covers input variables, accuracy bands per category and how we treat apps without comparable anchors.
See also the live data on Snellen Chart's tracker page for current rating, reviews and snapshot timeline.
Building something similar? Get a free AI audit with $-revenue forecasts for every recommendation.

 eMediNexus - Doctors Network
 App de verpleegkundige
 Gelbe Liste Medikamente App
 Clinicians Drug Reference
 Clinical Guidelines