ML revenue forecast.
Calibrated against 5375 apps in this category.
Confidence band
±15%
High — many comparable apps with verified data
At a glance
Earns 30.14× more than the category median (254/mo).
Ranks #107 of 5,375 in Strategy (top 2.0% by revenue).
Launched Feb 02, 2016 · last updated Jul 09, 2025.
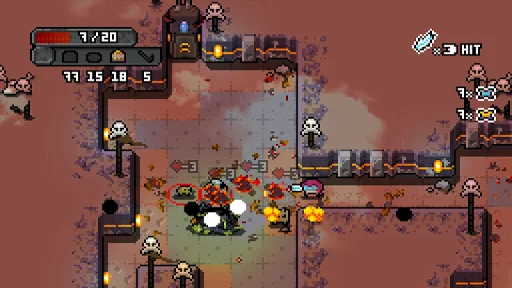
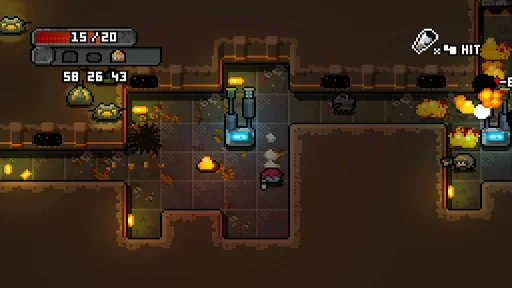
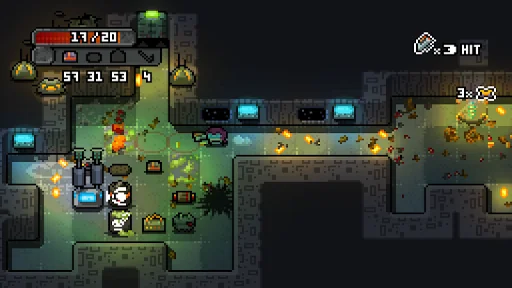
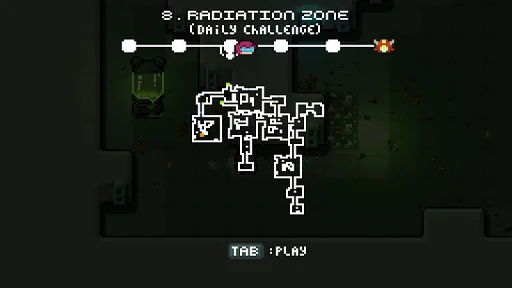
What the app looks like
Live screenshots from the Play Store, captured by our snapshot worker. Tap any image to enlarge.
Space Grunts's revenue trajectory
Forecast revenue from snapshot history. Last 1 months.
Where Space Grunts sits in Strategy
Revenue distribution of 5375 comparable apps. Space Grunts highlighted.
Space Grunts vs comparable apps
Revenue trajectory side-by-side. Bold = Space Grunts, ghosted = peers.
App spec
Version
1.7.4
Last update
Jul 09, 2025
Launched
Feb 02, 2016
Price
$6.49
Monetization
Paid
What Space Grunts actually does (from store listing)
Support, tip and tricks: http://www.orangepixel.net/forum/
Subscribe to our newsletter for new and exclusive content: http://orangepixel.net/subscribe
-------------------
Space Grunts combines fast paced arcade action with turn-based gameplay.
The year 2476, Earth's space-federation has been building moon-bases across the galaxy. One of those moon-bases has been sending a distress signal. Space Grunts are a group of intergalactic "problem" solvers, sent to investigate..
You play on…
Support, tip and tricks: http://www.orangepixel.net/forum/
Subscribe to our newsletter for new and exclusive content: http://orangepixel.net/subscribe
-------------------
Space Grunts combines fast paced arcade action with turn-based gameplay.
The year 2476, Earth's space-federation has been building moon-bases across the galaxy. One of those moon-bases has been sending a distress signal. Space Grunts are a group of intergalactic "problem" solvers, sent to investigate..
You play one, out of a team, of Space Grunts, and your mission is simple: find your way into the moon-base, and figure out what has happened. You'll have to fight your way through aliens, robots, security drones and base-systems. Find the lower levels of the moon-base, and get to the core of the problems.
Consumables
A large collection of consumables can be found all over the moon base from weapon enhancers, to destructive toys, armor, explosives, system-hacks, and more. Use the items wisely to advance deeper into the moon-base.
Weapons
Starting with three standard Grunt weapons, you will be able to enhance them for more fire-power and range. On your way you'll also find alternate weapons, and melee weapons.
Secrets
There are various ways to complete the game, anomalies leading to weird places, underground routes, and mysterious items to transport you to other area's of the moon-base. On top of these there are secret rooms and area's located all over the base, so never a dull moment!
Can you find the core of the problems?
Got questions? need tips or help? visit our forums:
http://orangepixel.net
or connect and say hi:
twitter.com/orangepixel
facebook.com/orangepixel
Comparable Android apps
The five apps in Strategy with the closest revenue to Space Grunts. Click any to see its detail page.
Each forecast combines App Store rating, ratings count, monetisation model, pricing tier, IAP signals and ad-supported flag.
The base estimate is then multiplied by a per-category scaling factor learned from apps with founder-verified MRR.
Every number on this page comes from public APIs and bumetric's own snapshot history.
Full methodology covers input variables, accuracy bands per category and how we treat apps without comparable anchors.
See also the live data on Space Grunts's tracker page for current rating, reviews and snapshot timeline.
Building something similar? Get a free AI audit with $-revenue forecasts for every recommendation.

 Battlevoid: Sector Siege
 Tropico
 European War 3
 Papa's Scooperia To Go!
 Castle Clash: World Ruler