What SPIE Conferences actually does (from store listing)
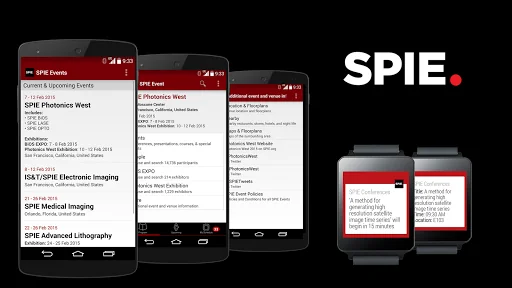
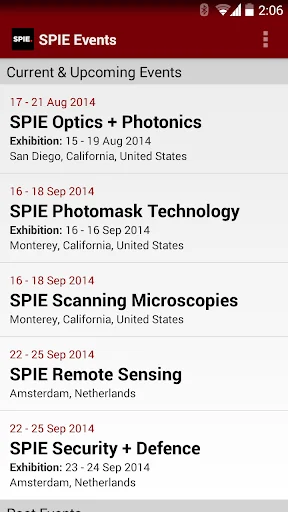
Hold the program and exhibition guides for all current and upcoming SPIE conferences and exhibitions, including SPIE Photonics West, SPIE DSS, and SPIE Optics + Photonics, in the palm of your hand.
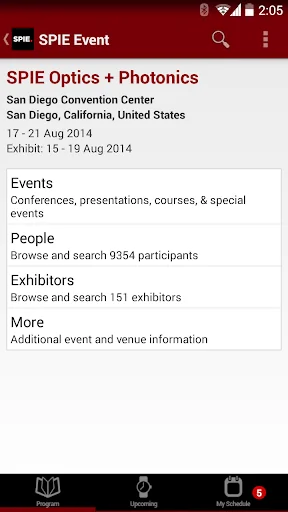
* Complete programs of all SPIE symposia including events, exhibitors, and participants.
* Sync My Schedule between your mobile device and desktop computer.
* Be notified when events added to My Schedule are about to begin.
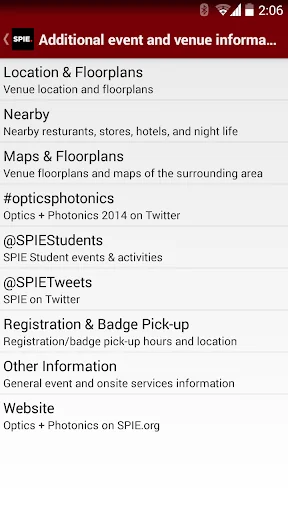
* Google Maps integration provides views of nearby resta…
Hold the program and exhibition guides for all current and upcoming SPIE conferences and exhibitions, including SPIE Photonics West, SPIE DSS, and SPIE Optics + Photonics, in the palm of your hand.
* Complete programs of all SPIE symposia including events, exhibitors, and participants.
* Sync My Schedule between your mobile device and desktop computer.
* Be notified when events added to My Schedule are about to begin.
* Google Maps integration provides views of nearby restaurants, stores, and venues.
* Search for participants, presentations, or events with Google's voice commands
SPIE is the international society for optics and photonics, a not-for-profit organization founded in 1955 to advanced light-based technologies. The Society serves nearly 260,000 constituents from approximately 162 countries, offering conferences, continuing education, books, journals, and a digital library in support of interdisciplinary information exchange, professional growth, and patent precedent. SPIE provided over $3.2 million in support of education and outreach programs in 2013.
Comparable Android apps
The five apps in Productivity with the closest revenue to SPIE Conferences. Click any to see its detail page.
Each forecast combines App Store rating, ratings count, monetisation model, pricing tier, IAP signals and ad-supported flag.
The base estimate is then multiplied by a per-category scaling factor learned from apps with founder-verified MRR.
Every number on this page comes from public APIs and bumetric's own snapshot history.
Full methodology covers input variables, accuracy bands per category and how we treat apps without comparable anchors.
See also the live data on SPIE Conferences's tracker page for current rating, reviews and snapshot timeline.
Building something similar? Get a free AI audit with $-revenue forecasts for every recommendation.

 Subastanet
 Challenge Alarm Clock
 QmailClient
 SmartHome Heizungssteuerung
 Kalendar Malaysia