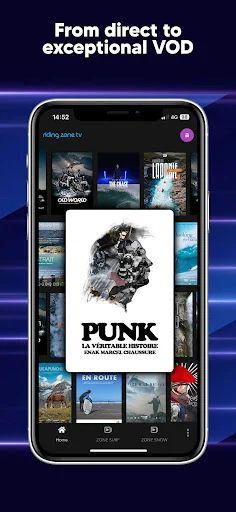
SPORTALL, THE VIDEO PLATFORM FOR ALL SPORTS - With Sportall, follow all your favorite sports directly from your smartphone, tablet, and on your TV. Every sport has its fans, and every fan wants to see more content, all with complete freedom. Access live events, replays, documentaries, interviews, and more.
Why the Sportall App:
- Live Streaming: Watch your favorite sports events live, wherever you are. Don’t miss a single match, competition, or tournament.
- Replay: Relive the best moment…
SPORTALL, THE VIDEO PLATFORM FOR ALL SPORTS - With Sportall, follow all your favorite sports directly from your smartphone, tablet, and on your TV. Every sport has its fans, and every fan wants to see more content, all with complete freedom. Access live events, replays, documentaries, interviews, and more.
Why the Sportall App:
- Live Streaming: Watch your favorite sports events live, wherever you are. Don’t miss a single match, competition, or tournament.
- Replay: Relive the best moments of your favorite events with replay videos.
- Exclusive Content: Access exclusive interviews and reports on your favorite teams and athletes.
- Multisport: Athletics, swimming, para sports, combat sports, squash, surfing & skateboarding, motorsports, lacrosse, rugby, and much more... Follow an incredible range of sports with just one app.
- Personalization: Create your own news feed by selecting your favorite sports, teams, and competitions for a tailored experience.
- Real-Time Notifications: Receive instant alerts for the start of a competition or the arrival of a key moment. Never miss a thing with the Sportall app.
SPORTALL is above all the 100% SPORTS video platform that allows you to follow all your favorite sports directly on your smartphone, tablet, and on your TV (equipped with Chromecast technology). Follow ALL the sports you love through a variety of content on the same unique and innovative app.
Want to see more sports? Discover the list of sports available on the app here:
Athletics
Boxing
BMX
Breaking
Canoeing & Kayaking
Climbing
Futsal
Para Sports
Wrestling & Associated Disciplines
MMA
Swimming
Artistic Swimming
Open Water Swimming
Rugby
Skiing
Water Skiing
Snowboarding
Aquatic Sports
Extreme Sports
Teqball
Trail Running
Triathlon
Mountain Biking
Water Polo
Privacy Policy: https://sportall.tv/privacy
Terms of Service: https://sportall.tv/tos
Comparable Android apps
The five apps in Sports with the closest revenue to SPORTALL. Click any to see its detail page.
Each forecast combines App Store rating, ratings count, monetisation model, pricing tier, IAP signals and ad-supported flag.
The base estimate is then multiplied by a per-category scaling factor learned from apps with founder-verified MRR.
Every number on this page comes from public APIs and Bumetric's own snapshot history.
Full methodology covers input variables, accuracy bands per category and how we treat apps without comparable anchors.
See also the live data on SPORTALL's tracker page for current rating, reviews and snapshot timeline.
Building something similar? Get a free AI audit with $-revenue forecasts for every recommendation.


 Tampa Bay Baseball
 Digitec SW
 DIRTVision
 Storsjöcupen
 Tippd - Last Man Standing.