What SportsEngine Motion actually does (from store listing)
The SportsEngine Motion Mobile App gives business administrators, coaches, and families direct access to their entire organization from anywhere, making it easier to communicate, track attendance and skills, invoice and collect payments, and stay up-to-date with all important information and events at their organization.
Administrators who have signed their business up for the SportsEngine Motion platform can use its companion mobile app for free, along with their coaches and families.…
The SportsEngine Motion Mobile App gives business administrators, coaches, and families direct access to their entire organization from anywhere, making it easier to communicate, track attendance and skills, invoice and collect payments, and stay up-to-date with all important information and events at their organization.
Administrators who have signed their business up for the SportsEngine Motion platform can use its companion mobile app for free, along with their coaches and families. Simply use your SportsEngine email and password to login. Not a customer? Learn more at www.motion.sportsengine.com.
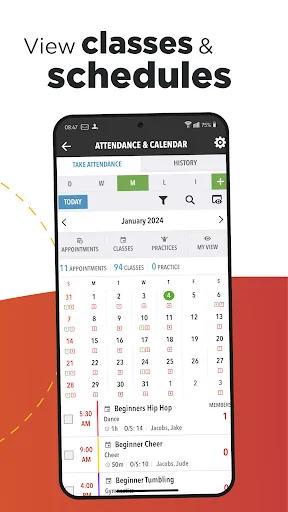
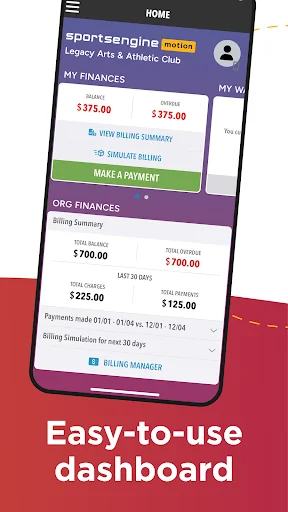
With SportsEngine Motion, parents can access their members’ information, attendance, billing, organization updates, events, videos and more all from one location, keeping them better connected with their organization.
Administrators will love having direct access to all of their organization data such as family and member contact information, messaging, billing and invoicing, news creation, volunteer job management, events and much more.
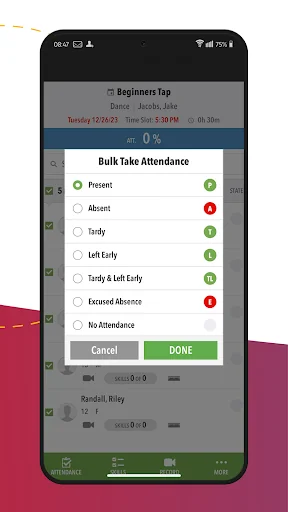
Coaches can simplify their days with direct access to family contact information and medical notes, attendance tracking, video production and sharing, organization and member updates, and access to a social sharing toolkit to publish organization updates to Facebook, Twitter, Instagram and the organization website.
SportsEngine Motion is a powerful application that will keep your organization more connected, updated, and organized than ever before. Download the app today to get started!
SPORTSENGINE TERMS OF USE: https://www.sportsengine.com/terms-of-use
SPORTSENGINE PRIVACY POLICY:
https://www.versantprivacy.com/privacy
Comparable Android apps
The five apps in Sports with the closest revenue to SportsEngine Motion. Click any to see its detail page.
Each forecast combines App Store rating, ratings count, monetisation model, pricing tier, IAP signals and ad-supported flag.
The base estimate is then multiplied by a per-category scaling factor learned from apps with founder-verified MRR.
Every number on this page comes from public APIs and bumetric's own snapshot history.
Full methodology covers input variables, accuracy bands per category and how we treat apps without comparable anchors.
See also the live data on SportsEngine Motion's tracker page for current rating, reviews and snapshot timeline.
Building something similar? Get a free AI audit with $-revenue forecasts for every recommendation.

 NTBA
NTBA
 PLAY by TeamHub
 FootNews.be
 THE FAN 107.5
 Golfamore (Golfhaftet)