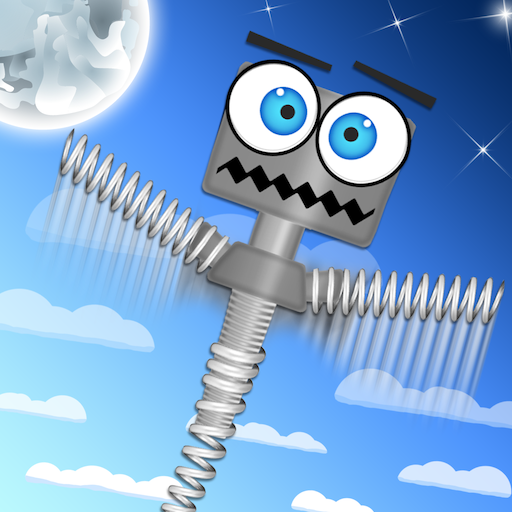
Boing! BOING! Boing! How high can you go? Can you make it to the clouds? The Moon? Pluto?
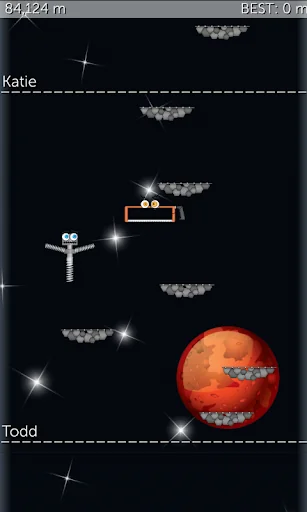
Bounce Springer as high as you can for a dangerous but exciting adventure. Jump high in the sky and travel through space.
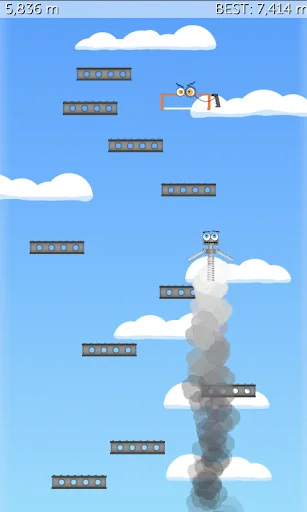
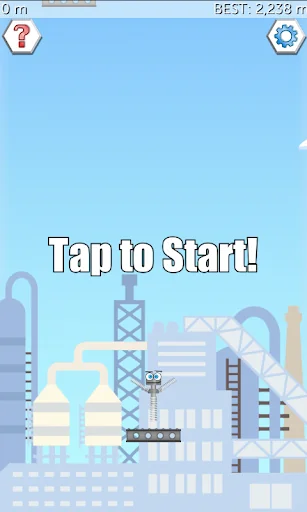
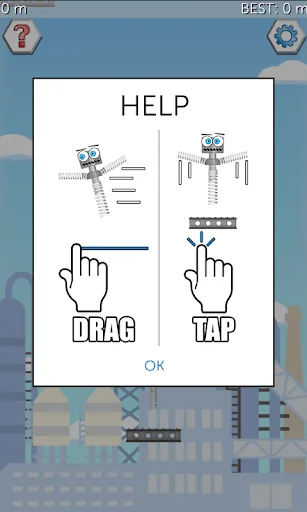
Drag your finger across the screen to move Springer to a safe platform. Tap upon landing on a platform for a super bounce! Grab onto rockets to blast off and launch through the stratosphere and beyond.
But… keep an eye out for the evil Dr. Hacksaw! Springer is made of light-…
Boing! BOING! Boing! How high can you go? Can you make it to the clouds? The Moon? Pluto?
Bounce Springer as high as you can for a dangerous but exciting adventure. Jump high in the sky and travel through space.
Drag your finger across the screen to move Springer to a safe platform. Tap upon landing on a platform for a super bounce! Grab onto rockets to blast off and launch through the stratosphere and beyond.
But… keep an eye out for the evil Dr. Hacksaw! Springer is made of light-weight nuts, bolts, and springs that'll explode on impact.
Can you make it higher than your friends? Bounce right past their highest altitude in-game while posting yours to the global leaderboard.
Spring to the stars and beyond!
Features:
- Fun and challenging addictive platformer
- Infinite vertical scrolling adventure
- Highly responsive yet simple touch controls
- Tour the solar system from Earth to the Moon and beyond
- Google Play integration for seeing friend's scores in-game
- HD support for smartphones and tablets
- Full support for Android Lollipop 5.0 including Nexus 6 and 9
- Free!
Comparable Android apps
The five apps in Adventure with the closest revenue to Springer. Click any to see its detail page.
Each forecast combines App Store rating, ratings count, monetisation model, pricing tier, IAP signals and ad-supported flag.
The base estimate is then multiplied by a per-category scaling factor learned from apps with founder-verified MRR.
Every number on this page comes from public APIs and bumetric's own snapshot history.
Full methodology covers input variables, accuracy bands per category and how we treat apps without comparable anchors.
See also the live data on Springer's tracker page for current rating, reviews and snapshot timeline.
Building something similar? Get a free AI audit with $-revenue forecasts for every recommendation.
 The Mooseman
 Flying Police Robot Hero Games
 Chicken Run
 BridgeBuilder
 서울 2033