What Stinker Stores actually does (from store listing)
Get stinkin’ awesome offers and rewards with the Stinker App - your all-in-one companion for Stinker stores across Idaho, Colorado, and Wyoming! From special discounts to freebies and exclusive coupons, we’ve got everything you need to make your stop at Stinker even better.
Key Features:
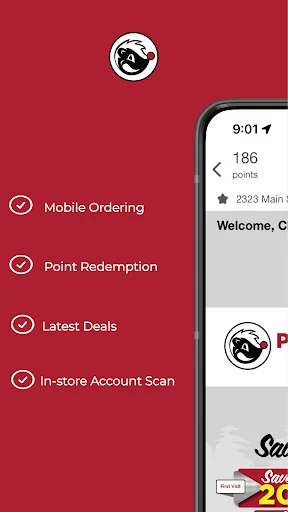
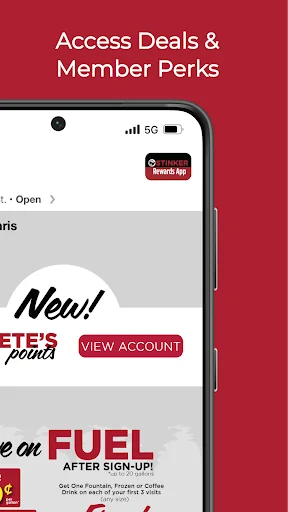
• Exclusive Deals: Unlock special discounts, rewards, and offers available through the app.
• Coupons & Freebies: Save big with our digital coupons and enjoy freebies on the go.
• Earn Points: C…
Get stinkin’ awesome offers and rewards with the Stinker App - your all-in-one companion for Stinker stores across Idaho, Colorado, and Wyoming! From special discounts to freebies and exclusive coupons, we’ve got everything you need to make your stop at Stinker even better.
Key Features:
• Exclusive Deals: Unlock special discounts, rewards, and offers available through the app.
• Coupons & Freebies: Save big with our digital coupons and enjoy freebies on the go.
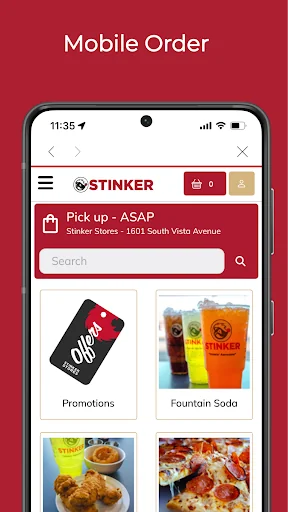
• Earn Points: Collect points on fuel and in-store purchases, and redeem them for rewards.
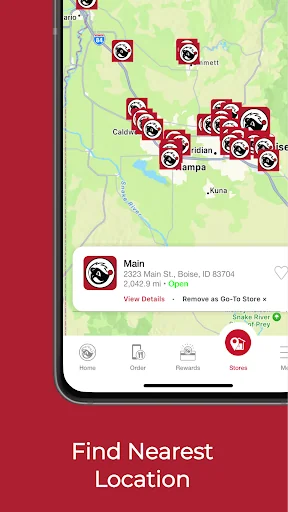
• Store Locator: Find the nearest Stinker store anytime, anywhere, and discover the services you need—24/7!
• Personalized Experience: Stay up-to-date with notifications tailored just for you.
Download now and enjoy the convenience and savings that come with being a Stinker VIP. Don’t miss out on the best deals—be stinkin’ awesome today!
Comparable Android apps
The five apps in Business with the closest revenue to Stinker Stores. Click any to see its detail page.
Each forecast combines App Store rating, ratings count, monetisation model, pricing tier, IAP signals and ad-supported flag.
The base estimate is then multiplied by a per-category scaling factor learned from apps with founder-verified MRR.
Every number on this page comes from public APIs and bumetric's own snapshot history.
Full methodology covers input variables, accuracy bands per category and how we treat apps without comparable anchors.
See also the live data on Stinker Stores's tracker page for current rating, reviews and snapshot timeline.
Building something similar? Get a free AI audit with $-revenue forecasts for every recommendation.

 Sunrise Stores
 Meetingbox
 Entretien RH : Questions Répon
 Streamz AI
 AMIS CRM 2