stockaxis –Your trusted equity research partner in stock market investing.
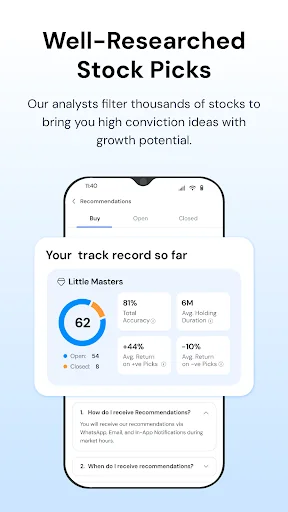
stockaxis empowers serious investors with well-researched stock ideas, based on a proven strategy.
What You Get:
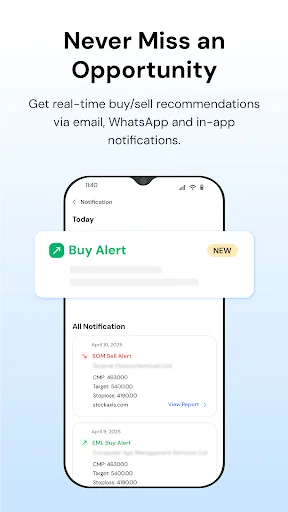
• Timely buy/sell stock recommendations
• Delivered via App, Email & WhatsApp
• Based on our proprietary MILARS® stock selection strategy
• SEBI-registered Research Analyst & Investment Adviser
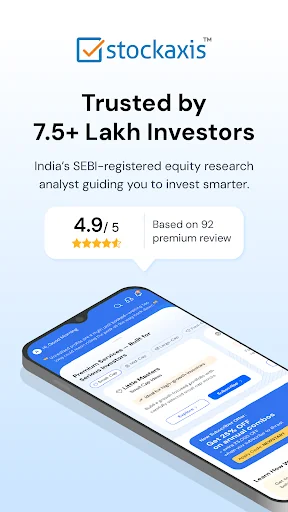
• Trusted by thousands of investors across India
How We Help You Succeed:
We simplify stock invest…
stockaxis –Your trusted equity research partner in stock market investing.
stockaxis empowers serious investors with well-researched stock ideas, based on a proven strategy.
What You Get:
• Timely buy/sell stock recommendations
• Delivered via App, Email & WhatsApp
• Based on our proprietary MILARS® stock selection strategy
• SEBI-registered Research Analyst & Investment Adviser
• Trusted by thousands of investors across India
How We Help You Succeed:
We simplify stock investing using MILARS®, a 6-factor strategy that filters high-quality stocks based on:
1. Market Direction
2. Industry Ranking
3. Leading Companies
4. Acceleration in Earnings
5. Relative Price Strength
6. Selling Rules
With stockaxis, you are not just investing; you are investing wisely.
Why Choose stockaxis?
• SEBI Registered (INH000007669 & INA000011644)
• Transparent track record of performance
• Personalized support from dedicated RMs
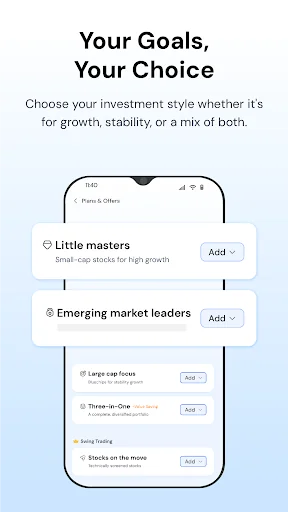
• Flagship services: Little Masters, Emerging Market Leaders, Large Cap Focus & more
• Simple onboarding with Aadhaar eSign & KYC
Start your journey toward research-based investing today.
Download the stockaxis App & build a growth portfolio!
Comparable Android apps
The five apps in Finance with the closest revenue to stockaxis. Click any to see its detail page.
Each forecast combines App Store rating, ratings count, monetisation model, pricing tier, IAP signals and ad-supported flag.
The base estimate is then multiplied by a per-category scaling factor learned from apps with founder-verified MRR.
Every number on this page comes from public APIs and bumetric's own snapshot history.
Full methodology covers input variables, accuracy bands per category and how we treat apps without comparable anchors.
See also the live data on stockaxis's tracker page for current rating, reviews and snapshot timeline.
Building something similar? Get a free AI audit with $-revenue forecasts for every recommendation.

 Dolar Blue Hoy
 AFmobile®
 CoinTracking
 HVCU
HVCU
 EMI Calculator