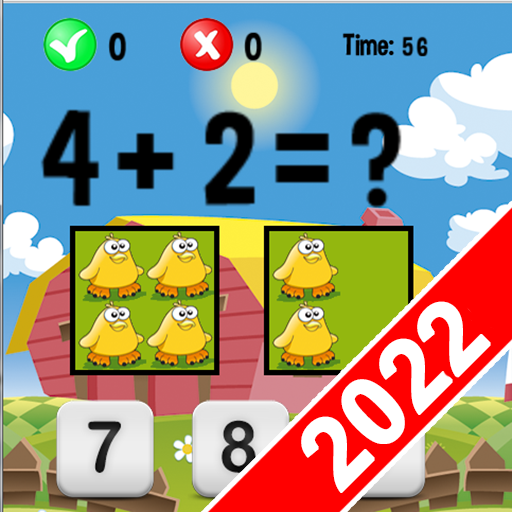
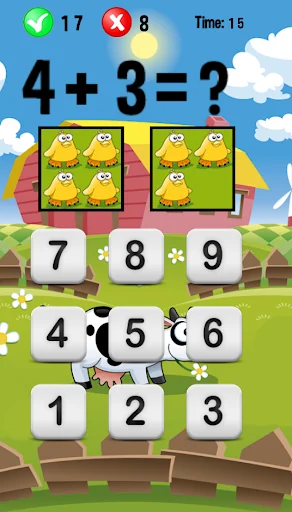
Discover the most fun way to learn math with Addition for Kids, the educational game that turns learning into pure entertainment. Specially designed for young students, this interactive game helps children master addition while having fun with colorful objects and animations.
Key Features:
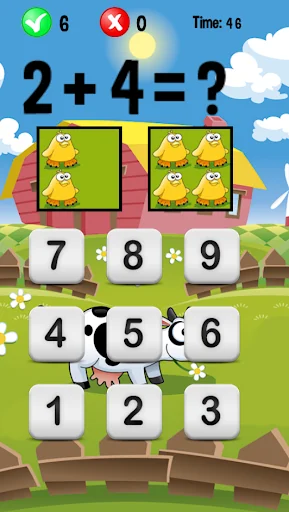
Intuitive and colorful interface designed for children
Interactive objects that make learning visual and tactile
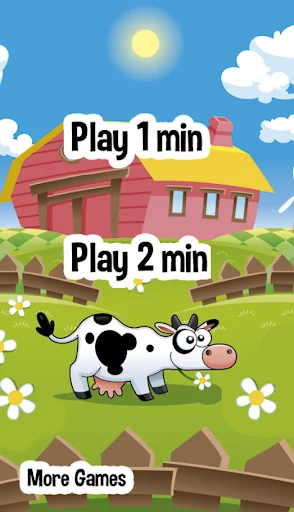
Progressive levels that adapt to each child's pace
Basic math presented in a playful way
…
Discover the most fun way to learn math with Addition for Kids, the educational game that turns learning into pure entertainment. Specially designed for young students, this interactive game helps children master addition while having fun with colorful objects and animations.
Key Features:
Intuitive and colorful interface designed for children
Interactive objects that make learning visual and tactile
Progressive levels that adapt to each child's pace
Basic math presented in a playful way
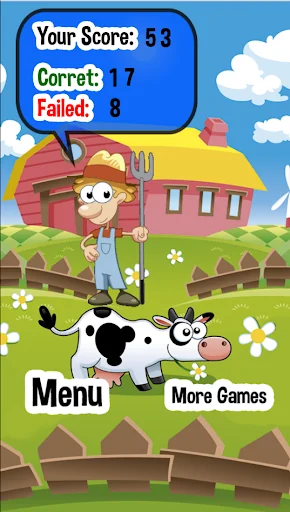
Perfect for reinforcing what's learned at school or as an introduction to basic mathematics. Parents will find in this app a reliable educational tool that combines entertainment with effective learning.
Ideal for children aged 3 to 8 years. Download it for free and watch your child develop their math skills while having fun!
Comparable Android apps
The five apps in Educational with the closest revenue to sums Kids. Click any to see its detail page.
Each forecast combines App Store rating, ratings count, monetisation model, pricing tier, IAP signals and ad-supported flag.
The base estimate is then multiplied by a per-category scaling factor learned from apps with founder-verified MRR.
Every number on this page comes from public APIs and bumetric's own snapshot history.
Full methodology covers input variables, accuracy bands per category and how we treat apps without comparable anchors.
See also the live data on sums Kids's tracker page for current rating, reviews and snapshot timeline.
Building something similar? Get a free AI audit with $-revenue forecasts for every recommendation.
 Coloring book for kids
 A Day with Caillou
 Coloring games : coloring book
 Little Farm Life
 TRT Yarışçı