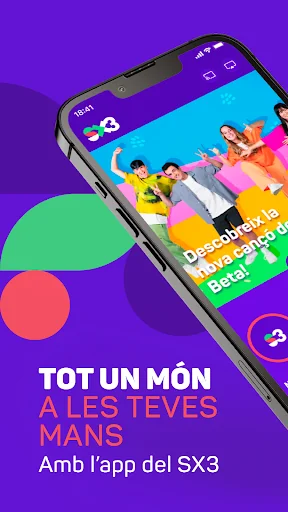
All the series and programs of the SX3, in your hands!
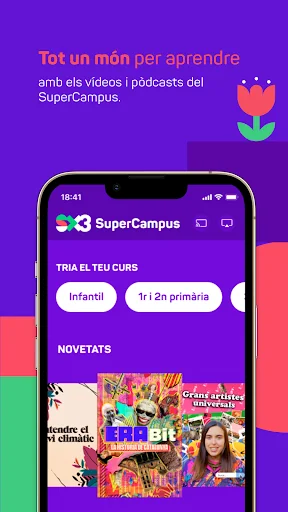
In the S3 world, designed for the little ones, you will find Mic, Titó, "El Món del Pot Petit", "Els contes de la Pinya", the songs of Fa La La and series such as "El xai Shaun" , “Numberblocks”, “Masha and the Bone”, “The Three Twins” and many more friends who will make you sing, dance and enjoy... also in English!
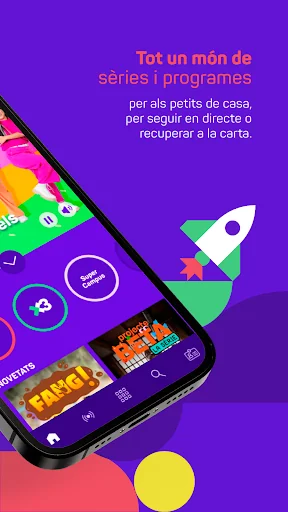
If you're more of an X3 fan, here you'll find the series and programs that demand it the most! Anime, video clips, scienc…
All the series and programs of the SX3, in your hands!
In the S3 world, designed for the little ones, you will find Mic, Titó, "El Món del Pot Petit", "Els contes de la Pinya", the songs of Fa La La and series such as "El xai Shaun" , “Numberblocks”, “Masha and the Bone”, “The Three Twins” and many more friends who will make you sing, dance and enjoy... also in English!
If you're more of an X3 fan, here you'll find the series and programs that demand it the most! Anime, video clips, science, cooking, adventures and lots of laughs. You'll become a fan of Beta, follower of "Random", get informed with "InfoK" and have a great time with many other programs.
And, if you're super, your card will go with you, wherever you go.
With the SX3 app you can always have your virtual card in your pocket. Take advantage of it! It is your entry key to the community and will open the doors to a world of experiences, free activities and exclusive competitions.
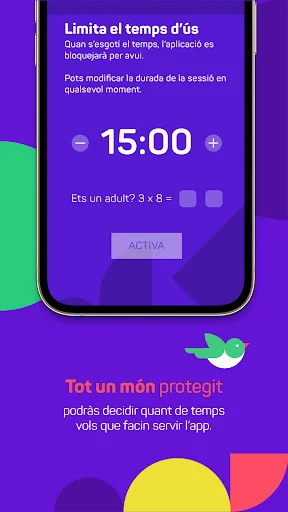
Time of use
Adults will find the possibility to choose how long you want the little ones in the house to have the SX3 app in their hands.
This is the new SX3, a whole world in your hands.
We are SX3. And you?
Comparable Android apps
The five apps in Entertainment with the closest revenue to SX3. Click any to see its detail page.
Each forecast combines App Store rating, ratings count, monetisation model, pricing tier, IAP signals and ad-supported flag.
The base estimate is then multiplied by a per-category scaling factor learned from apps with founder-verified MRR.
Every number on this page comes from public APIs and bumetric's own snapshot history.
Full methodology covers input variables, accuracy bands per category and how we treat apps without comparable anchors.
See also the live data on SX3's tracker page for current rating, reviews and snapshot timeline.
Building something similar? Get a free AI audit with $-revenue forecasts for every recommendation.

 Harkins Theatres
 BOBO Lite - Group Voice Chat
 Insomniac Events
 Hiper Cap Mogi
 Princess Crash Course Diary