What Tabletopia actually does (from store listing)
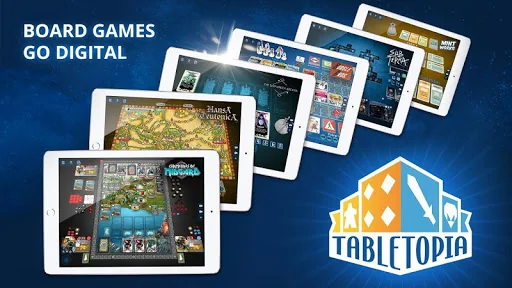
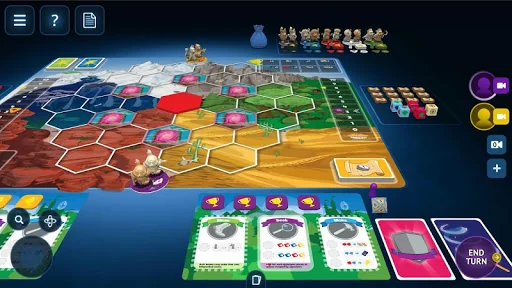
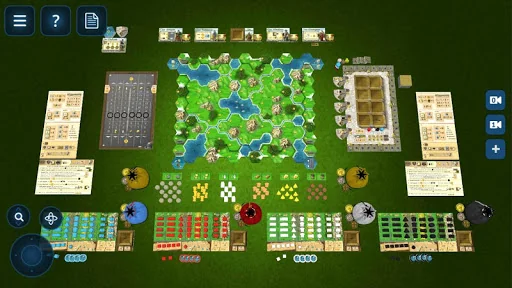
Tabletopia is a digital online platform for playing board games just like in real life. There is no AI to enforce the rules. Read the rulebook, choose a seat at the virtual table, and let the game begin!
Mobile (Beta) features:
• Solo, Hotseat and Online Multiplayer modes
• Create digital versions of your own board games to promote, playtest, and demonstrate them!
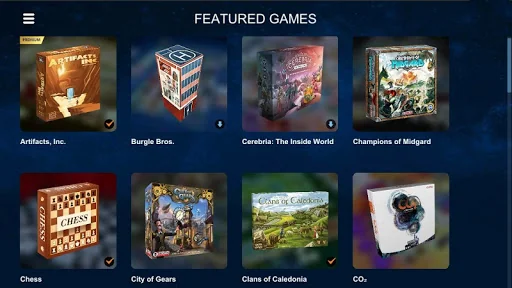
• Many great games are already available, such as:
Champions of Midgard
A hit worker placement game about Viking clans wa…
Tabletopia is a digital online platform for playing board games just like in real life. There is no AI to enforce the rules. Read the rulebook, choose a seat at the virtual table, and let the game begin!
Mobile (Beta) features:
• Solo, Hotseat and Online Multiplayer modes
• Create digital versions of your own board games to promote, playtest, and demonstrate them!
• Many great games are already available, such as:
Champions of Midgard
A hit worker placement game about Viking clans waging war against mythological Norse beasts by Grey Fox Games
The Shipwreck Arcana
Very clever cooperative deduction game by Meromorph Games
Hansa Teutonica
One of the best competitive eurogames about creating trade network in medieval Germany by Argentum Verlag
Sub Terra
Cooperative survival horror board game by Inside the Box
Burgle Bros
Cooperative stealth game about daring robbery by Fowers Games
Tuscany
New edition of very popular worker placement game about managing your own winery by Stonemaier Games.
Explore our Featured catalog to find even more different games. We are constantly working on adapting more games from our extensive web catalog into mobile format.
Comparable Android apps
The five apps in Board with the closest revenue to Tabletopia. Click any to see its detail page.
Each forecast combines App Store rating, ratings count, monetisation model, pricing tier, IAP signals and ad-supported flag.
The base estimate is then multiplied by a per-category scaling factor learned from apps with founder-verified MRR.
Every number on this page comes from public APIs and bumetric's own snapshot history.
Full methodology covers input variables, accuracy bands per category and how we treat apps without comparable anchors.
See also the live data on Tabletopia's tracker page for current rating, reviews and snapshot timeline.
Building something similar? Get a free AI audit with $-revenue forecasts for every recommendation.
 Mahjong Blossom
 Backgammon Classic
 Farkle Dice Game: 10000 Seas
 Red Mahjong GC
 Tac Tik