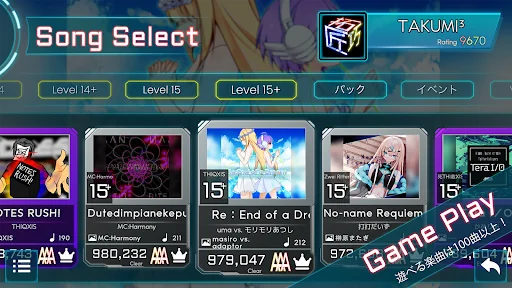
A rhythm game (Notes Tap Game) where you tap the notes that fall in rhythm while responding to the lanes and notes that change according to the song.
There are more than 30 songs that can be played from the beginning, and many more that can be unlocked just by playing for free!
Included songs (excerpt)
Re: End of a Dream / uma vs. Morimori Atsushi
volcanic / DETRO a.k.a Luze
DENGEKI Tube / BACO
BPM=RT / t+pazolite
tundra / Halv
Connection Destination: Utopia / kuro
With a wide range…
A rhythm game (Notes Tap Game) where you tap the notes that fall in rhythm while responding to the lanes and notes that change according to the song.
There are more than 30 songs that can be played from the beginning, and many more that can be unlocked just by playing for free!
Included songs (excerpt)
Re: End of a Dream / uma vs. Morimori Atsushi
volcanic / DETRO a.k.a Luze
DENGEKI Tube / BACO
BPM=RT / t+pazolite
tundra / Halv
Connection Destination: Utopia / kuro
With a wide range of difficulty levels, this game can be enjoyed by both beginners and advanced players!
In addition, difficulty level 15 is for very, very advanced players!
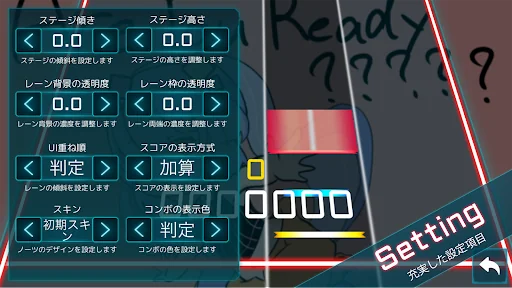
The author is a serious sound gamer, so there are many useful options from the player's perspective!
You can adjust the speed and judgment of the game.
Lane height/angle/notes skin
Lane height/angle/notes skin
You can adjust the lane height, angle, notes skin, lane background, lane frame color, and more to create a game screen that suits you!
The author of the game is also a music gamer and a private person, so we are always open to feedback from players and aim to make the game easier to play!
Comparable Android apps
The five apps in Music with the closest revenue to TAKUMI³. Click any to see its detail page.
Each forecast combines App Store rating, ratings count, monetisation model, pricing tier, IAP signals and ad-supported flag.
The base estimate is then multiplied by a per-category scaling factor learned from apps with founder-verified MRR.
Every number on this page comes from public APIs and bumetric's own snapshot history.
Full methodology covers input variables, accuracy bands per category and how we treat apps without comparable anchors.
See also the live data on TAKUMI³'s tracker page for current rating, reviews and snapshot timeline.
Building something similar? Get a free AI audit with $-revenue forecasts for every recommendation.


 Gamelan Bali Digital
 Play Virtual Guitar
 Berpacu Dalam Melodi
 Magic Cat Tiles - Cute Piano
 Darbuka tambourine & drum