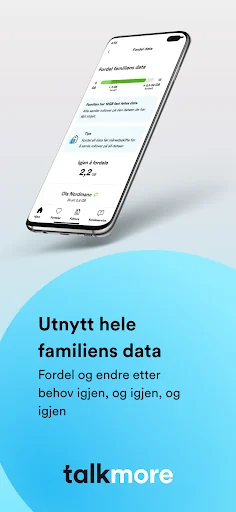
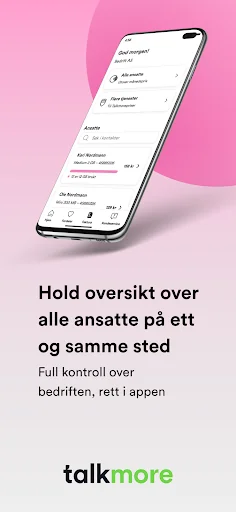
We at Talkmore believe that you as a customer should be able to see, change and manage what you need completely yourself - quickly and easily. That's why we have a wide range of functions in the app, both for you as a private customer and a business customer.
Can't find what you want to see or do? No problem, because with the Talkmore app you have customer service right in your pocket. Our skilled customer advisors are only a few keystrokes away!
Good to know:
- To download and use the …
We at Talkmore believe that you as a customer should be able to see, change and manage what you need completely yourself - quickly and easily. That's why we have a wide range of functions in the app, both for you as a private customer and a business customer.
Can't find what you want to see or do? No problem, because with the Talkmore app you have customer service right in your pocket. Our skilled customer advisors are only a few keystrokes away!
Good to know:
- To download and use the app, you must have mobile data or WiFi access.
- New customer? When you register with us, you should have received an email with a username and password. If you can't find the email, you can always use the Forgot password function.
- The app is constantly being developed and improved. Errors, wishes or suggestions? Contact us on 91509915, chat or via the contact form - and we will look into the matter together.
Comparable Android apps
The five apps in Finance with the closest revenue to Talkmore. Click any to see its detail page.
Each forecast combines App Store rating, ratings count, monetisation model, pricing tier, IAP signals and ad-supported flag.
The base estimate is then multiplied by a per-category scaling factor learned from apps with founder-verified MRR.
Every number on this page comes from public APIs and bumetric's own snapshot history.
Full methodology covers input variables, accuracy bands per category and how we treat apps without comparable anchors.
See also the live data on Talkmore's tracker page for current rating, reviews and snapshot timeline.
Building something similar? Get a free AI audit with $-revenue forecasts for every recommendation.


 CMSO suivi de compte et budget
 SIBL NOW
 Blackcatcard
 Intesa Sanpaolo Assicurazioni
 בנק יהב - ניהול חשבון