ML revenue forecast.
Calibrated against 29524 apps in this category.
Confidence band
±15%
High — many comparable apps with verified data
At a glance
Earns 4.22× more than the category median (192/mo).
Ranks #3,216 of 29,524 in Puzzle (top 10.9% by revenue).
Launched May 18, 2021 · last updated Jul 10, 2026.
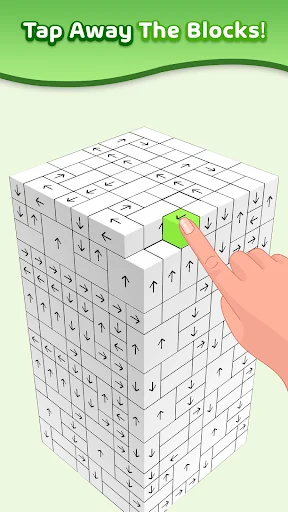
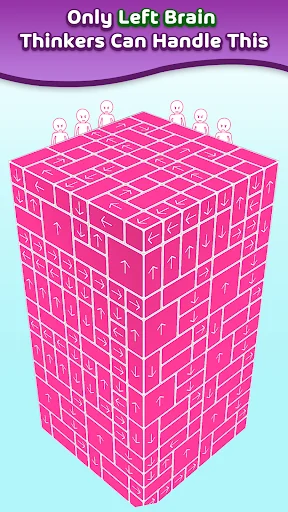
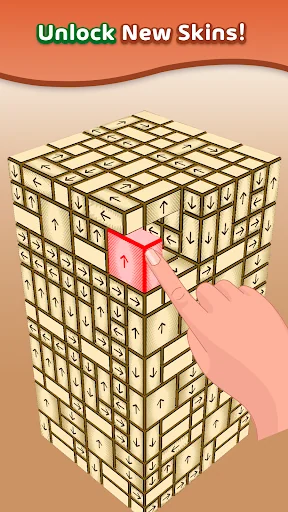
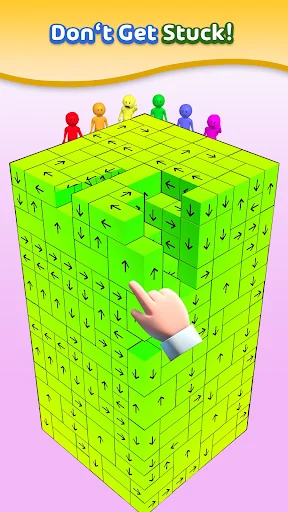
What the app looks like
Live screenshots from the Play Store, captured by our snapshot worker. Tap any image to enlarge.
Tap Away's revenue trajectory
Forecast revenue from snapshot history. Last 3 months.
Where Tap Away sits in Puzzle
Revenue distribution of 29524 comparable apps. Tap Away highlighted.
Tap Away vs comparable apps
Revenue trajectory side-by-side. Bold = Tap Away, ghosted = peers.
App spec
Version
169.0.2
Last update
Jul 10, 2026
Launched
May 18, 2021
Price
Free
Monetization
Free
What Tap Away actually does (from store listing)
Do you have what it takes to solve all the swiping levels? Connect all your braincells and put your skills to the test! Tap Away all the blocks in this exciting puzzle.
Tap Away is brought to you by Popcore, makers of hit puzzle games with more than 250 million combined installs!
Tap Away is a fun and addictive 3D puzzle game, but it’s more than just that - it’s a brain teaser that will take you to the next level!
Tap the blocks to make them fly away and clear the screen. But the blocks…
Do you have what it takes to solve all the swiping levels? Connect all your braincells and put your skills to the test! Tap Away all the blocks in this exciting puzzle.
Tap Away is brought to you by Popcore, makers of hit puzzle games with more than 250 million combined installs!
Tap Away is a fun and addictive 3D puzzle game, but it’s more than just that - it’s a brain teaser that will take you to the next level!
Tap the blocks to make them fly away and clear the screen. But the blocks will only fly in one direction, so you’ve got to approach this brain teaser carefully! Slide your finger around the screen to rotate the shape and attack the blocks from every angle! As you progress, the blocks form bigger and bigger shapes, and the blocks themselves change form, so you’ll need to get your thinking hat on to solve the puzzles in this 3D puzzle game. And that’s not it! There are skins and themes you can unlock as you get further, as well as challenges to keep you on your toes. In this fun and colorful game, you challenge your logic, critical thinking, and precision. Do you have what it takes?
WITH TAP AWAY YOU CAN
▶ PLAY the full 3D puzzle game experience offline and on the go.
▶ SWIPE to rotate the shape and choose your next move.
▶ TAP the blocks to clear the level.
▶ CUSTOMIZE your blocks with different skins and themes.
▶ REACH the top!
WHY PLAY TAP AWAY?
▶ RELIEVE your stress.
▶ TEASE your brain with the satisfying taps.
▶ PRACTICE your critical thinking!
▶ LEARN the tricks to ensure Tap Away glory!
▶ ENJOY cool skins and themes to customize your journey!
What are you waiting for? Challenge your brain with this tricky game right now!
TALK TO US
Join your TAP AWAY crew on
▶ Web: https://popcore.com/
▶ Instagram: https://www.instagram.com/popcore
▶ TikTok: https://www.tiktok.com/@popcore
▶ Twitter: https://twitter.com/PopcoreOfficial
▶ Youtube: https://www.youtube.com/channel/UCq1BDUD72Rv7dXov7WtR9Og
DOWNLOAD AND PLAY NOW - Join this fun and satisfying puzzle game and tap away the blocks!
Comparable Android apps
The five apps in Puzzle with the closest revenue to Tap Away. Click any to see its detail page.
Each forecast combines App Store rating, ratings count, monetisation model, pricing tier, IAP signals and ad-supported flag.
The base estimate is then multiplied by a per-category scaling factor learned from apps with founder-verified MRR.
Every number on this page comes from public APIs and bumetric's own snapshot history.
Full methodology covers input variables, accuracy bands per category and how we treat apps without comparable anchors.
See also the live data on Tap Away's tracker page for current rating, reviews and snapshot timeline.
Building something similar? Get a free AI audit with $-revenue forecasts for every recommendation.

 Dream Home - House Design
 Tic-Tac-Toe
 Brain Puzzle Games
 Stones & Sails
 Nature Jigsaw Puzzles