What Taronga Zoo actually does (from store listing)
With over 4000 animals to see and 20 Keeper Talks and Shows a day, you’ll need a helping hand to get the most out of your day at Taronga Zoo Sydney. Download the official Taronga Zoo App. It’s a must-have companion for your Zoo visit! Browse the interactive Map, see up-to-date info on Sky Safari, keeper talks, shows and animal encounters, discover kid’s Wild Squad Missions and much more!
Features:
- The Interactive Map will show you where you are in the Zoo and give you directions and estimate…
With over 4000 animals to see and 20 Keeper Talks and Shows a day, you’ll need a helping hand to get the most out of your day at Taronga Zoo Sydney. Download the official Taronga Zoo App. It’s a must-have companion for your Zoo visit! Browse the interactive Map, see up-to-date info on Sky Safari, keeper talks, shows and animal encounters, discover kid’s Wild Squad Missions and much more!
Features:
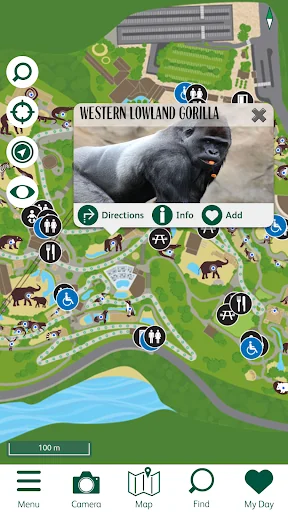
- The Interactive Map will show you where you are in the Zoo and give you directions and estimated distance to all the animals, events and more!
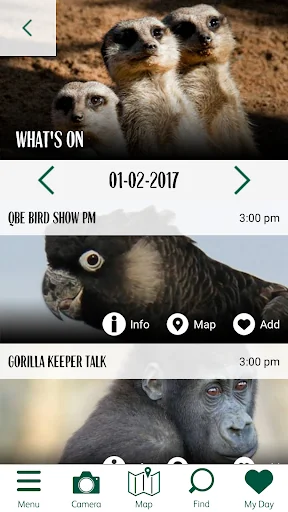
- “What’s On” will give you the latest schedule for the Zoo’s Sky Safari, Shows, Talks and Encounters. Never miss a Show or Talk again by adding them to “My Day”. You’ll get a reminder when they are about to start.
- Learn more about the amazing Zoo animals via our proximity sensing iBeacons. Open the App and you’ll see more fascinating facts in front of over 20 animals at the Zoo.
- Take a walk on the wild side with the fun, quick and interactive Wild Squad Missions. They will get the kid’s learning more about conservation and the animals they’re seeing at the Zoo
Comparable Android apps
The five apps in Travel & Local with the closest revenue to Taronga Zoo. Click any to see its detail page.
Each forecast combines App Store rating, ratings count, monetisation model, pricing tier, IAP signals and ad-supported flag.
The base estimate is then multiplied by a per-category scaling factor learned from apps with founder-verified MRR.
Every number on this page comes from public APIs and Bumetric's own snapshot history.
Full methodology covers input variables, accuracy bands per category and how we treat apps without comparable anchors.
See also the live data on Taronga Zoo's tracker page for current rating, reviews and snapshot timeline.
Building something similar? Get a free AI audit with $-revenue forecasts for every recommendation.


 taxy
 Congonhas-São Paulo (CGH) Info
 valdoise MyBalade
 Sydney Culture Walks
 campersAPP