What TD MySpend actually does (from store listing)
The TD MySpend app helps you to stay on top of your spending. Make sure you have the latest version of the TD Canada app in order to use TD MySpend.
By clicking "install", you consent to the installation of the TD MySpend app provided by the TD Bank Group* and to any future updates/upgrades. You are also acknowledging that you understand that the TD MySpend app and any future updates/upgrades will/may perform the function described below. You may withdraw your consent at any time by deleting …
The TD MySpend app helps you to stay on top of your spending. Make sure you have the latest version of the TD Canada app in order to use TD MySpend.
By clicking "install", you consent to the installation of the TD MySpend app provided by the TD Bank Group* and to any future updates/upgrades. You are also acknowledging that you understand that the TD MySpend app and any future updates/upgrades will/may perform the function described below. You may withdraw your consent at any time by deleting or uninstalling this app.
The TD MySpend app is free to download, however standard wireless carrier message and data rates may apply.
TD MySpend helps you keep track of your money so you can improve your spending habits. As a TD customer, download the TD MySpend companion app, and your TD personal bank account and TD Credit Card Account transactions are automatically available in TD MySpend to monitor your spending.
• Daily Digest – receive a summary of the previous day's transactions and choose when you want to be notified (between 7:00 and 11:00 a.m. each morning)
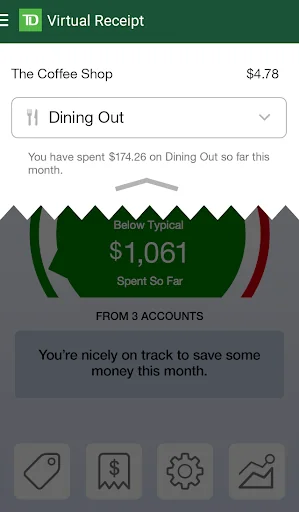
• Stay on top of your spending with real-time notifications every time there's a transaction in an eligible category.
• Transactions are automatically categorized for you so you know exactly where your money goes.
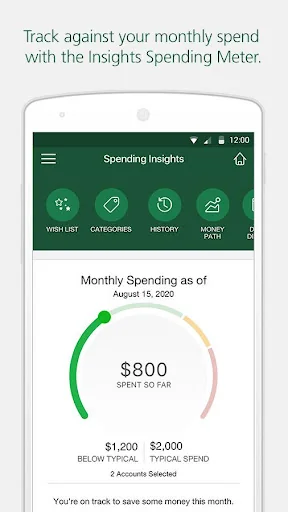
• Use the Spending Insights Meter to get a glimpse of how you're spending now compared to your spending in the past
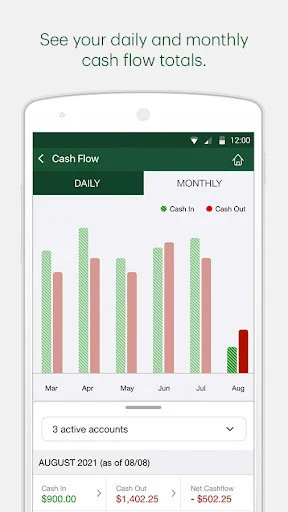
• Review and compare your current spending with Money Path to see if there are spikes in your spending habits.
IMPORTANT DISCLOSURES ABOUT THE TD MYSPEND APP
TD MySpend is a companion to the TD (Canada) app. To use TD MySpend, the TD (Canada) app must also be installed on your device.
TD MySpend is best experienced with Android version 5.0 and above. Experience and functionality may vary with other Android versions.
If you require assistance call 1-866-222-3456, mail TD CASL Office, Toronto Dominion Centre, PO Box 1, Toronto ON, M5K 1A2, or email at customer.support@td.com.
*The Toronto-Dominion Bank and its affiliates are collectively known as TD Bank Group and include the following businesses: TD Canada Trust, TD Wealth, TD Direct Investing, TD Insurance, TD Auto Finance, TD Asset Management, TD Commercial Banking, TD Merchant Services and TD Securities.
Comparable Android apps
The five apps in Finance with the closest revenue to TD MySpend. Click any to see its detail page.
Each forecast combines App Store rating, ratings count, monetisation model, pricing tier, IAP signals and ad-supported flag.
The base estimate is then multiplied by a per-category scaling factor learned from apps with founder-verified MRR.
Every number on this page comes from public APIs and Bumetric's own snapshot history.
Full methodology covers input variables, accuracy bands per category and how we treat apps without comparable anchors.
See also the live data on TD MySpend's tracker page for current rating, reviews and snapshot timeline.
Building something similar? Get a free AI audit with $-revenue forecasts for every recommendation.



 Exchange rates of Russia
 Khedmah
 Stock Screener
 DigiFinex- Crypto Exchange
 FCU Mobile Banking