TDU. Your directory of discounts and promotions in your Cellphone.
Applying mobile TDU is permanent directory to see discounts of 10% and up to 50% at more than 9,500 affiliated stores.
• With a National Coverage in over 120 cities in Mexico, with Restaurants, Hotels, Agencies Automotive, Boutiques, Stores, Laboratories, Optical, Dry Cleaning, Schools, Toys Bookstores unlimited usage.
• Basic information of establishments: percentage discount and / or promotion, restrictions, address (g…
TDU. Your directory of discounts and promotions in your Cellphone.
Applying mobile TDU is permanent directory to see discounts of 10% and up to 50% at more than 9,500 affiliated stores.
• With a National Coverage in over 120 cities in Mexico, with Restaurants, Hotels, Agencies Automotive, Boutiques, Stores, Laboratories, Optical, Dry Cleaning, Schools, Toys Bookstores unlimited usage.
• Basic information of establishments: percentage discount and / or promotion, restrictions, address (geolocation), phone (s), web page categorization by rotation
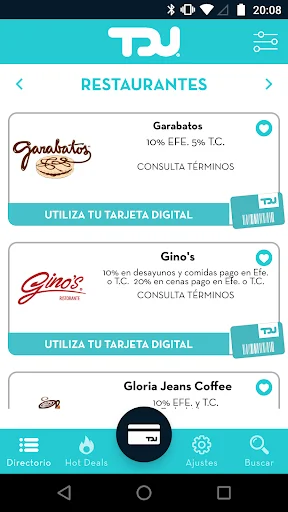
• In DF Metropolitan and local affiliates are categorized by money, which is located area, and restaurants by cuisine type.
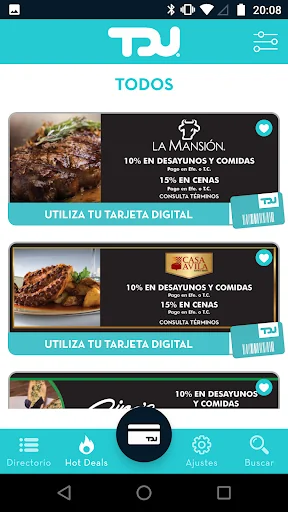
• Plus you'll get Attractive Promotions Hot Deals through a part of the permanent discounts.
• Locate affiliated establishments have close to within 5 km of your location through integration of Maps.
• And last but not least always stay informed via the Push Notification of new benefits and more.
• You can configure the application according to the state in which you live or to which you plan to travel soon.
• It has also, in section suggestions and / or comments, you can propose establishments where you would like to be affiliated with our TOU Discount Network.
• Communication LAN for automatic updating information of establishments
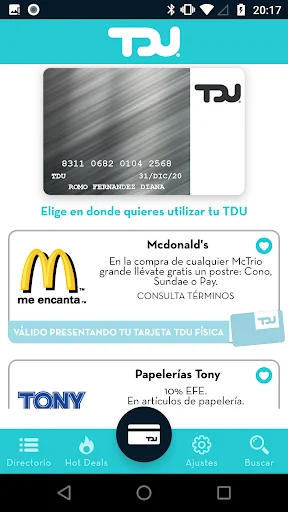
The TDU application has a friendly interface, easy to use and access. The establishments are organized in alphabetical list. It also allows you to search according to the name of the establishment, locate the address of each branch through maps, dial the appropriate phone and go to your website with one click.
Comparable Android apps
The five apps in Lifestyle with the closest revenue to TDU. Click any to see its detail page.
Each forecast combines App Store rating, ratings count, monetisation model, pricing tier, IAP signals and ad-supported flag.
The base estimate is then multiplied by a per-category scaling factor learned from apps with founder-verified MRR.
Every number on this page comes from public APIs and bumetric's own snapshot history.
Full methodology covers input variables, accuracy bands per category and how we treat apps without comparable anchors.
See also the live data on TDU's tracker page for current rating, reviews and snapshot timeline.
Building something similar? Get a free AI audit with $-revenue forecasts for every recommendation.

 Meat Cuts
 Gardenize: Garden & Plant care
 Pulsd
Pulsd
 Collaborations Watch Faces
 Muslimedia: Media Islami