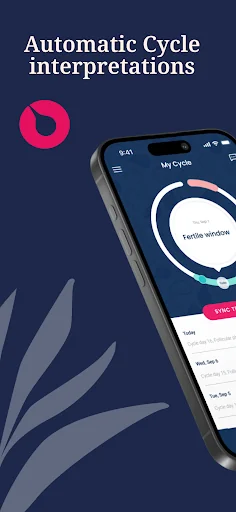
Tempdrop brings the full fertility tracking solution to your smartphone. Whether you are looking to increase your chances of conceiving, or are practicing fertility awareness methods, Tempdrop is tailored to you.
Tempdrop’s wearable sensor and accompanying charting app brings the full fertility charting solution to your smartphone. Using the latest scientific knowledge to bring you an accurate method of cycle tracking and identification of your fertile window. Tempdrop’s smart algorithm learn…
Tempdrop brings the full fertility tracking solution to your smartphone. Whether you are looking to increase your chances of conceiving, or are practicing fertility awareness methods, Tempdrop is tailored to you.
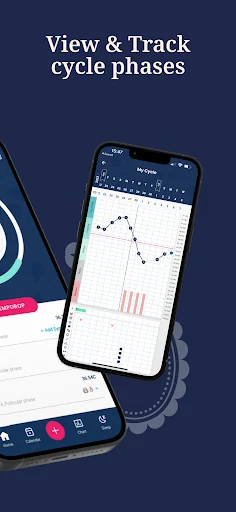
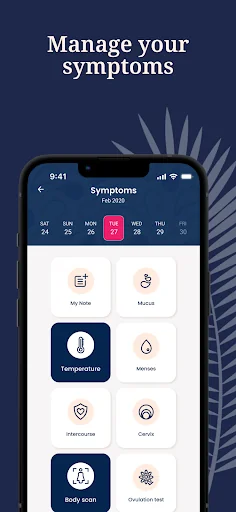
Tempdrop’s wearable sensor and accompanying charting app brings the full fertility charting solution to your smartphone. Using the latest scientific knowledge to bring you an accurate method of cycle tracking and identification of your fertile window. Tempdrop’s smart algorithm learns your unique nightly and monthly temperature patterns, filtering out disturbances for accurate results. Simply wear the sensor on your upper arm when you sleep and sync it to the app whenever it's convenient.
Tempdrop provides continuous monitoring and filters out waking times to give you the true nightly sleeping temperature.
Tempdrop offers a free basic app version with the possibility of upgrading to premium in order to benefit from advanced features including fertility insights, sleep quality data, a calendar view and more.
Comparable Android apps
The five apps in Health & Fitness with the closest revenue to Tempdrop. Click any to see its detail page.
Each forecast combines App Store rating, ratings count, monetisation model, pricing tier, IAP signals and ad-supported flag.
The base estimate is then multiplied by a per-category scaling factor learned from apps with founder-verified MRR.
Every number on this page comes from public APIs and Bumetric's own snapshot history.
Full methodology covers input variables, accuracy bands per category and how we treat apps without comparable anchors.
See also the live data on Tempdrop's tracker page for current rating, reviews and snapshot timeline.
Building something similar? Get a free AI audit with $-revenue forecasts for every recommendation.


 Interval Timer - Tabata Timer
 Studio Bloom
 CZmoudil
 Fitbrick2
 Meridian Health Clock