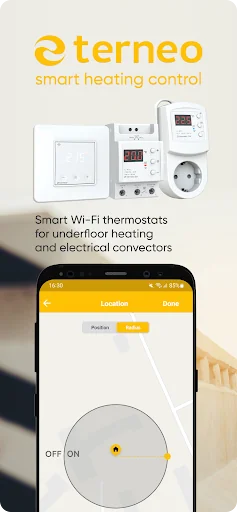
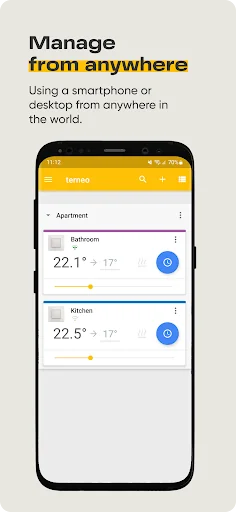
Operate your Wi-Fi heating controller terneo ™, wherever you are — in bed, aboard or at the other end of the world. Use your daily time-schedule to save electricity. Achieve impeccable comfort within doors thanks to wide settings!
OPERATE ALL WI-FI HEATING CONTROLLERS TERNEO ™ WITHIN ONE APPLICATION. You can add any quantity of devices to your account. Even if they are in different rooms. Even if they are in different houses. You do not want to customize each heating controller separately? J…
Operate your Wi-Fi heating controller terneo ™, wherever you are — in bed, aboard or at the other end of the world. Use your daily time-schedule to save electricity. Achieve impeccable comfort within doors thanks to wide settings!
OPERATE ALL WI-FI HEATING CONTROLLERS TERNEO ™ WITHIN ONE APPLICATION. You can add any quantity of devices to your account. Even if they are in different rooms. Even if they are in different houses. You do not want to customize each heating controller separately? Just copy settings from one heating controller to another.
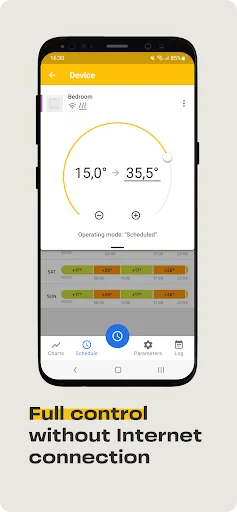
IMPLEMENTATION OF HEATING ACCORDING TO YOUR SCHEDULE. You can add up to 16 temperature intervals for each day.
STATISTICS OF HEATING DYNAMICS per day, week, month or year. Analyze past heating data and optimize the heating schedule in future.
DEPARTURE. Schedule start of heating at date of your return from vacation. During your absence, the heating controller terneo will maintain set economy temperature.
INTUITIVE INTERFACE. Period of service of the device in saving mode is highlighted green, and time of maintaining a comfortable temperature is highlighted yellow and orange.
Comparable Android apps
The five apps in House & Home with the closest revenue to terneo. Click any to see its detail page.
Each forecast combines App Store rating, ratings count, monetisation model, pricing tier, IAP signals and ad-supported flag.
The base estimate is then multiplied by a per-category scaling factor learned from apps with founder-verified MRR.
Every number on this page comes from public APIs and bumetric's own snapshot history.
Full methodology covers input variables, accuracy bands per category and how we treat apps without comparable anchors.
See also the live data on terneo's tracker page for current rating, reviews and snapshot timeline.
Building something similar? Get a free AI audit with $-revenue forecasts for every recommendation.


 Deal Workflow Real Estate CRM
 Rentals.ca - Apartment Finder
 Color Muse
 Real Messenger
 TrendAgent