ML revenue forecast.
Calibrated against 77127 apps in this category.
Confidence band
±15%
High — many comparable apps with verified data
At a glance
Earns 17.98× more than the category median (177/mo).
Ranks #326 of 77,127 in Entertainment (top 0.4% by revenue).
Launched Mar 14, 2012 · last updated Jun 10, 2026.
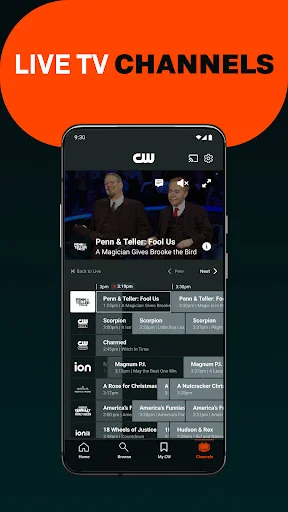
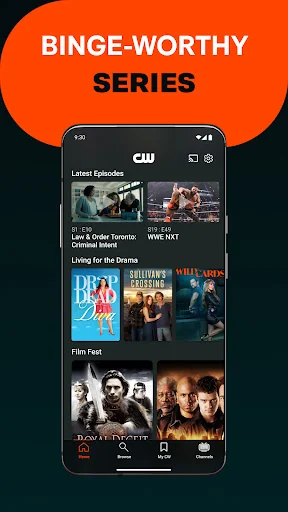
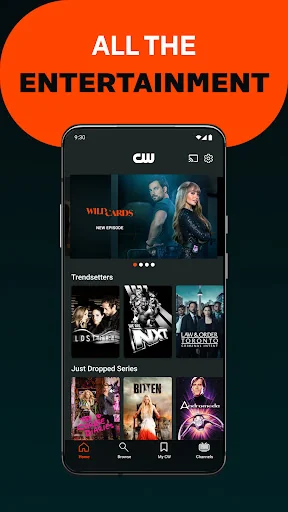
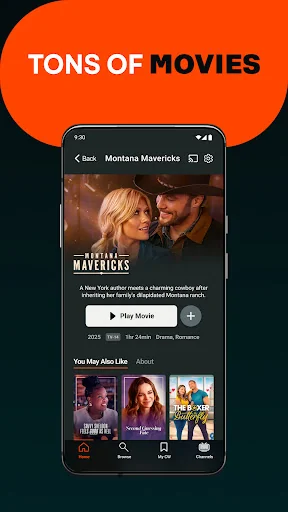
What the app looks like
Live screenshots from the Play Store, captured by our snapshot worker. Tap any image to enlarge.
The CW's revenue trajectory
Forecast revenue from snapshot history. Last 2 months.
Where The CW sits in Entertainment
Revenue distribution of 77127 comparable apps. The CW highlighted.
The CW vs comparable apps
Revenue trajectory side-by-side. Bold = The CW, ghosted = peers.
App spec
Version
Varies with device
Last update
Jun 10, 2026
Launched
Mar 14, 2012
Price
Free
Monetization
Free
What The CW actually does (from store listing)
Stream all the latest episodes from The CW, plus movies, sports, and full series! Keep up with new episodes of All American and Sullivan’s Crossing, stream hit series like Wild Cards, Drop Dead Diva, Law & Order Toronto and Marvel’s Runaways, or find your new favorite film in our fast-growing movie collection. And we’ve got sports! Stream NASCAR O'Reilly Auto Parts Series races live and catch up on the latest action from the PAC-12 football and WWE NXT.
Features Include:
LATEST EPISODES: Wat…
Stream all the latest episodes from The CW, plus movies, sports, and full series! Keep up with new episodes of All American and Sullivan’s Crossing, stream hit series like Wild Cards, Drop Dead Diva, Law & Order Toronto and Marvel’s Runaways, or find your new favorite film in our fast-growing movie collection. And we’ve got sports! Stream NASCAR O'Reilly Auto Parts Series races live and catch up on the latest action from the PAC-12 football and WWE NXT.
Features Include:
LATEST EPISODES: Watch new episodes of primetime shows the day after broadcast.
FULL SERIES: Binge CW favorites like 90210, Beauty and the Beast and The Carrie Diaries, or discover new obsessions like Drop Dead Diva, Lost Girl, Bates Motel and Marvel’s Runaways.
MOVIES: New films are being added all the time.
CW SPORTS: All NASCAR O'Reilly Auto Parts Series practice and qualifying races are live and on demand, plus replay of all the action from the PAC-12 Football, Professional Bull Riders and WWE NXT.
CHANNELS: Stream 24/7 programming, there’s something for everyone.
PROFILE: Create a login and continue watching content on any device and create a watch list with My CW.
NO HASSLE: No cable subscription, no credit cards.
Please note: This app features Nielsen’s proprietary measurement software which will allow you to contribute to market research, like Nielsen’s TV Ratings. Please visit http://www.nielsen.com/digitalprivacy for more information.
Ad Choices: https://www.cwtv.com/thecw/privacy-policy/#advertising
Terms of Use: http://www.cwtv.com/thecw/terms-of-use/
Do Not Sell My Personal Information: https://privacycenter.cwtv.com/
Comparable Android apps
The five apps in Entertainment with the closest revenue to The CW. Click any to see its detail page.
Each forecast combines App Store rating, ratings count, monetisation model, pricing tier, IAP signals and ad-supported flag.
The base estimate is then multiplied by a per-category scaling factor learned from apps with founder-verified MRR.
Every number on this page comes from public APIs and bumetric's own snapshot history.
Full methodology covers input variables, accuracy bands per category and how we treat apps without comparable anchors.
See also the live data on The CW's tracker page for current rating, reviews and snapshot timeline.
Building something similar? Get a free AI audit with $-revenue forecasts for every recommendation.

 TS News+ - Noticias de Juegos
 Good morning, love images
 Patreon
 App Flame: Play & Earn
 Mommy Saver Plus