ML revenue forecast.
Calibrated against 24961 apps in this category.
Confidence band
±15%
High — many comparable apps with verified data
At a glance
Earns 2.7× more than the category median (181/mo).
Ranks #3,605 of 24,961 in Sports (top 14.4% by revenue).
Launched Jul 11, 2013 · last updated Jul 18, 2025.
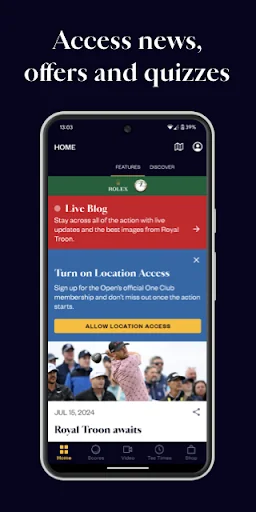
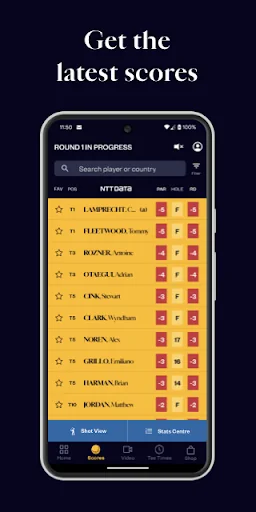
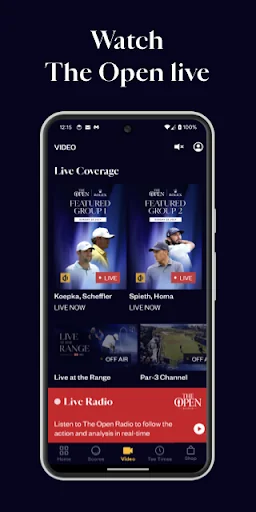
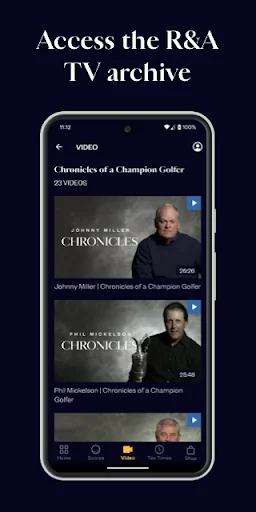
What the app looks like
Live screenshots from the Play Store, captured by our snapshot worker. Tap any image to enlarge.
The Open's revenue trajectory
Forecast revenue from snapshot history. Last 1 months.
Where The Open sits in Sports
Revenue distribution of 24961 comparable apps. The Open highlighted.
The Open vs comparable apps
Revenue trajectory side-by-side. Bold = The Open, ghosted = peers.
App spec
Version
1.1.4
Last update
Jul 18, 2025
Launched
Jul 11, 2013
Price
Free
Monetization
Free
What The Open actually does (from store listing)
Download The Open’s official app to enjoy live coverage of golf’s original Championship.
Here are just some of the features you can look forward to during The 153rd Open at Royal Portrush:
• Live coverage of The Open via R&A TV including feature group coverage, Live at the Range, Open Radio and a par-3 channel which will bring you live footage from the iconic Postage Stamp.
• Extensive coverage of The Open with the most up-to-date scoring available, tee times and a live blog.
• The lates…
Download The Open’s official app to enjoy live coverage of golf’s original Championship.
Here are just some of the features you can look forward to during The 153rd Open at Royal Portrush:
• Live coverage of The Open via R&A TV including feature group coverage, Live at the Range, Open Radio and a par-3 channel which will bring you live footage from the iconic Postage Stamp.
• Extensive coverage of The Open with the most up-to-date scoring available, tee times and a live blog.
• The latest Championship news, video highlights, in-depth features and much, much more.
The Open app will also have you covered every day of the year with our wide range of films and documentaries including our exclusive One Club Coaching videos with Phil Kenyon and Dr Bob Rotella, not to mention a host of enjoyable podcasts, while The Open Shop is just a click away.
So download The Open’s official app for free today.
Comparable Android apps
The five apps in Sports with the closest revenue to The Open. Click any to see its detail page.
Each forecast combines App Store rating, ratings count, monetisation model, pricing tier, IAP signals and ad-supported flag.
The base estimate is then multiplied by a per-category scaling factor learned from apps with founder-verified MRR.
Every number on this page comes from public APIs and bumetric's own snapshot history.
Full methodology covers input variables, accuracy bands per category and how we treat apps without comparable anchors.
See also the live data on The Open's tracker page for current rating, reviews and snapshot timeline.
Building something similar? Get a free AI audit with $-revenue forecasts for every recommendation.

 TVmatchen.nu - sport på TV
 NJPW Collection
 ArcadeBall: The Ramp Challenge
 חדשות הספורט
 GameDay App