ML revenue forecast.
Calibrated against 29524 apps in this category.
Confidence band
±15%
High — many comparable apps with verified data
At a glance
Earns 245.44× more than the category median (192/mo).
Ranks #1 of 29,524 in Puzzle (top 0.0% by revenue).
Launched Apr 05, 2013 · last updated Oct 13, 2025.
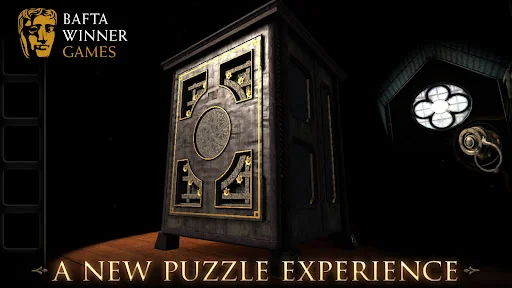
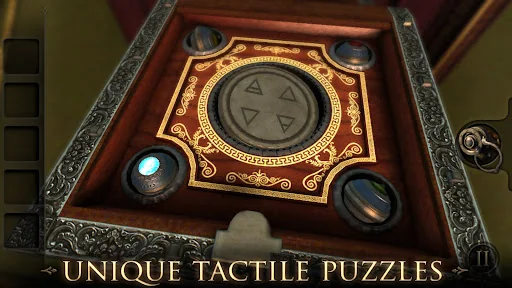
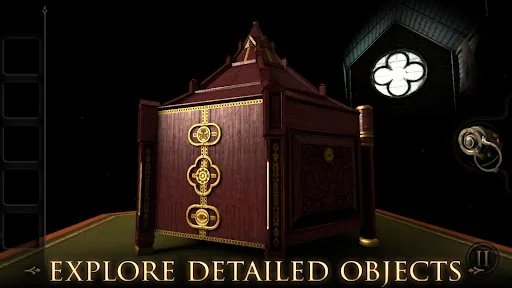
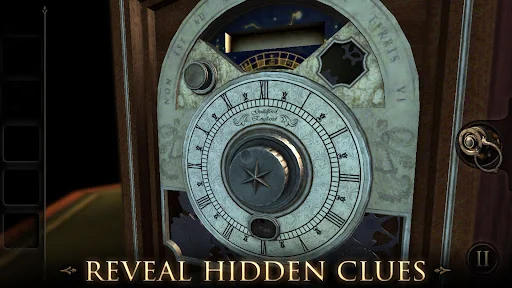
What the app looks like
Live screenshots from the Play Store, captured by our snapshot worker. Tap any image to enlarge.
The Room's revenue trajectory
Forecast revenue from snapshot history. Last 2 months.
Where The Room sits in Puzzle
Revenue distribution of 29524 comparable apps. The Room highlighted.
The Room vs comparable apps
Revenue trajectory side-by-side. Bold = The Room, ghosted = peers.
App spec
Version
1.11
Last update
Oct 13, 2025
Launched
Apr 05, 2013
Price
$0.99
Monetization
Paid
What The Room actually does (from store listing)
Welcome to The Room, a physical puzzler, wrapped in a mystery game, inside a beautifully tactile 3D world.
*****************
How are you, old friend? If you’re reading this, then it worked. I only hope you can still forgive me.
We’ve never seen eye to eye on my research, but you must put such things behind you. You are the only one to whom I can turn. You must come at once, for we are all in great peril. I trust you remember the house? My study is the highest room.
Press forward wi…
Welcome to The Room, a physical puzzler, wrapped in a mystery game, inside a beautifully tactile 3D world.
*****************
How are you, old friend? If you’re reading this, then it worked. I only hope you can still forgive me.
We’ve never seen eye to eye on my research, but you must put such things behind you. You are the only one to whom I can turn. You must come at once, for we are all in great peril. I trust you remember the house? My study is the highest room.
Press forward with heart. There is no way back now.
AS.
******
Fireproof Games are very proud to bring you our greatest creation, a mind-bending journey filled with beauty, peril and mystery in equal measure. Be transported into a unique space that blends spellbinding visuals with intriguing problems to solve.
• Unsettlingly realistic graphics: Vibrant natural-looking visuals perfected for mobile displays.
• Spine-tingling single finger controls: touch controls so natural you can play with one digit, to fully navigate this mysteriously beautiful 3D world.
• Fantastical pick-up-and-play design: Easy to start, hard to put down, the secrets of The Room will immerse you before you even know you're playing.
• Compelling layers of mystery: think you know what you're looking at? Think again.
Comparable Android apps
The five apps in Puzzle with the closest revenue to The Room. Click any to see its detail page.
Each forecast combines App Store rating, ratings count, monetisation model, pricing tier, IAP signals and ad-supported flag.
The base estimate is then multiplied by a per-category scaling factor learned from apps with founder-verified MRR.
Every number on this page comes from public APIs and bumetric's own snapshot history.
Full methodology covers input variables, accuracy bands per category and how we treat apps without comparable anchors.
See also the live data on The Room's tracker page for current rating, reviews and snapshot timeline.
Building something similar? Get a free AI audit with $-revenue forecasts for every recommendation.

 Monument Valley
 The Room Two
 Where's My Water?
 The Room Three
 Monument Valley 2