What Timesheet History actually does (from store listing)
Easy and fully customizable app to track your working hours and payments
Features:
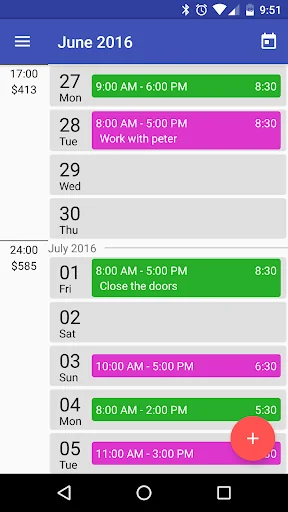
• See working hours and payment cycles at one glance
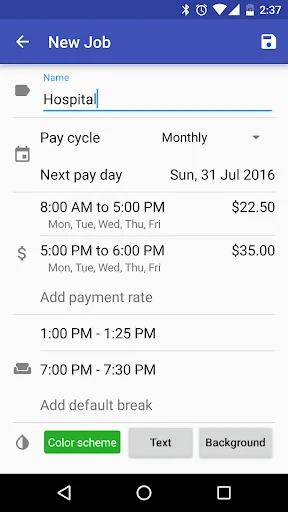
• Define default break times for each job
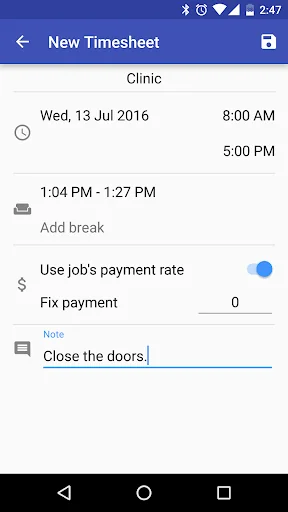
• Define different payment rates for different days and hours
• Define different color schemes for each job to make them more identifiable
• Add fix payment for each timesheet
• Define unpaid breaks for each job
• Use default unpaid breaks from a job or add a new one for each timesheet
• Create multiple …
Easy and fully customizable app to track your working hours and payments
Features:
• See working hours and payment cycles at one glance
• Define default break times for each job
• Define different payment rates for different days and hours
• Define different color schemes for each job to make them more identifiable
• Add fix payment for each timesheet
• Define unpaid breaks for each job
• Use default unpaid breaks from a job or add a new one for each timesheet
• Create multiple jobs (Limited to one job in Free Version)
• Scroll freely to the past or future and see all of your timesheets
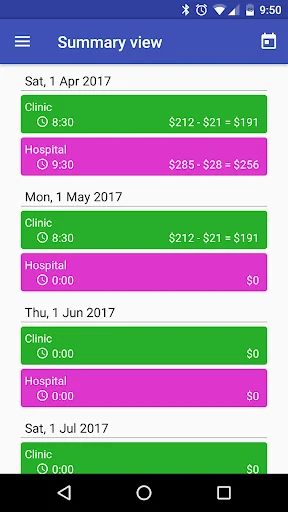
• See all of the jobs in one list
• Show payment errors in the list and individual timesheet
• Add deduction in the job setting
• Manual Backup, Auto Daily backup and Restore data to keep your information safe
• Share timesheet with others
• Export to Excel
Upcoming features:
• Reports
• Fast Clock-in\Clock-out
• Add timesheet for someone else remotely
• Clock-in\Clock-out from notification
• Notifications
And many more...
Please do not hesitate to send your request or suggestion to the below email:
Email: app.support@forutan.com
Comparable Android apps
The five apps in Productivity with the closest revenue to Timesheet History. Click any to see its detail page.
Each forecast combines App Store rating, ratings count, monetisation model, pricing tier, IAP signals and ad-supported flag.
The base estimate is then multiplied by a per-category scaling factor learned from apps with founder-verified MRR.
Every number on this page comes from public APIs and bumetric's own snapshot history.
Full methodology covers input variables, accuracy bands per category and how we treat apps without comparable anchors.
See also the live data on Timesheet History's tracker page for current rating, reviews and snapshot timeline.
Building something similar? Get a free AI audit with $-revenue forecasts for every recommendation.
 Arisan Kita
 Clean Swell
 MyLiquid Zambia
 AppSavy
 아이디스 모바일