Tippani is very small, simple and clean note taking app, aimed to keep our little notes organized.
- Works on both phones and tablets.
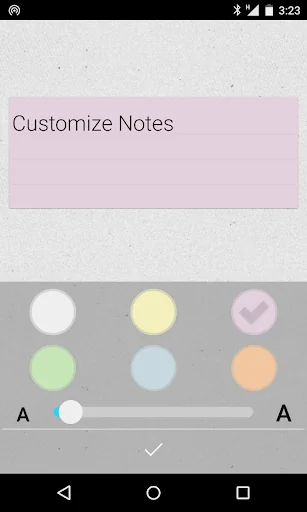
- Customization option like background color and text size
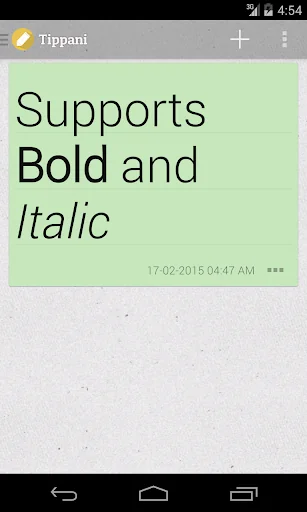
- Semi rich text with options of Bold and Italic font types
- Auto list using dash, number or alphabet
- Home screen and lock screen widgets
- Easy to share notes
- Clipboard suggestions
- Note can be added through Google Now by "note to self" or "take a note" command
- Sync with Google Drive™ …
Tippani is very small, simple and clean note taking app, aimed to keep our little notes organized.
- Works on both phones and tablets.
- Customization option like background color and text size
- Semi rich text with options of Bold and Italic font types
- Auto list using dash, number or alphabet
- Home screen and lock screen widgets
- Easy to share notes
- Clipboard suggestions
- Note can be added through Google Now by "note to self" or "take a note" command
- Sync with Google Drive™ ( available as an in app purchase )
- Export to various formats - .txt , .html
Tippani means Notes in Sanskrit.
Comparable Android apps
The five apps in Productivity with the closest revenue to Tippani. Click any to see its detail page.
Each forecast combines App Store rating, ratings count, monetisation model, pricing tier, IAP signals and ad-supported flag.
The base estimate is then multiplied by a per-category scaling factor learned from apps with founder-verified MRR.
Every number on this page comes from public APIs and bumetric's own snapshot history.
Full methodology covers input variables, accuracy bands per category and how we treat apps without comparable anchors.
See also the live data on Tippani's tracker page for current rating, reviews and snapshot timeline.
Building something similar? Get a free AI audit with $-revenue forecasts for every recommendation.


 Biermacht
 VIP Notes (trial)
 Scientific Molding
 한국달력
한국달력
 Track & Graph: Habit Tracker