ML revenue forecast.
Calibrated against 26282 apps in this category.
Confidence band
±15%
High — many comparable apps with verified data
At a glance
Tracks close to the Android app category median (173/mo).
Ranks #14,359 of 26,282 in Casual (top 54.6% by revenue).
Launched Oct 06, 2016 · last updated Oct 04, 2025.
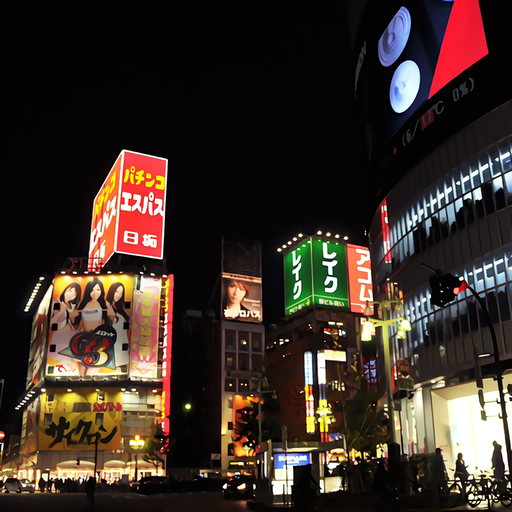
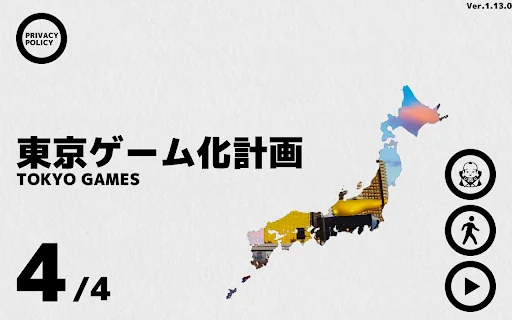
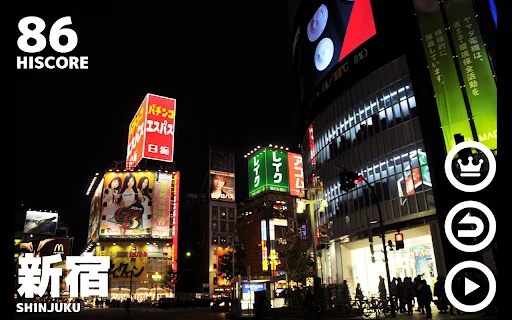
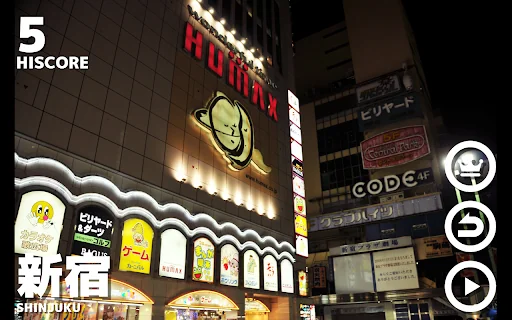
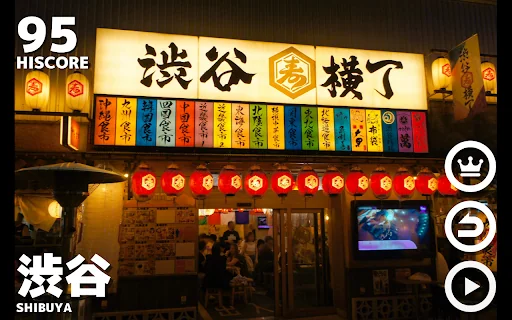
What the app looks like
Live screenshots from the Play Store, captured by our snapshot worker. Tap any image to enlarge.
TOKYO GAMES's revenue trajectory
Forecast revenue from snapshot history. Last 1 months.
Where TOKYO GAMES sits in Casual
Revenue distribution of 26282 comparable apps. TOKYO GAMES highlighted.
TOKYO GAMES vs comparable apps
Revenue trajectory side-by-side. Bold = TOKYO GAMES, ghosted = peers.
App spec
Version
1.14.0
Last update
Oct 04, 2025
Launched
Oct 06, 2016
Price
Free
Monetization
Free
What TOKYO GAMES actually does (from store listing)
It is a project to make Tokyo a game.
Currently, you can enjoy two different types of games.
"Shinjuku Whack-A-Mole"
It is an action game to quickly tap the Shinjuku neon.
Tap a lot of neon within the time limit, let's aim for a high score!
"Shinjuku Simon"
Remember the order in which the Shinjuku neon shines, it is a memory game to tap in order.
Remember a lot of order, let's aim for a high score!
"Shibuya Lights Out"
This is a puzzle game to turn on all the lights in Shibuya.
T…
It is a project to make Tokyo a game.
Currently, you can enjoy two different types of games.
"Shinjuku Whack-A-Mole"
It is an action game to quickly tap the Shinjuku neon.
Tap a lot of neon within the time limit, let's aim for a high score!
"Shinjuku Simon"
Remember the order in which the Shinjuku neon shines, it is a memory game to tap in order.
Remember a lot of order, let's aim for a high score!
"Shibuya Lights Out"
This is a puzzle game to turn on all the lights in Shibuya.
Tap a light in Shibuya, and the tapped point and the lights up, down, left, and right will be flipped on/off.
Aim for a high score by quickly turning on all the lights within the time limit.
"Asakusa Aha! Challenge"
Somewhere in the scenery of Asakusa, a small part is slowly changing.
Tap the changing spot as quickly as you can to aim for a high score!
Comparable Android apps
The five apps in Casual with the closest revenue to TOKYO GAMES. Click any to see its detail page.
Each forecast combines App Store rating, ratings count, monetisation model, pricing tier, IAP signals and ad-supported flag.
The base estimate is then multiplied by a per-category scaling factor learned from apps with founder-verified MRR.
Every number on this page comes from public APIs and bumetric's own snapshot history.
Full methodology covers input variables, accuracy bands per category and how we treat apps without comparable anchors.
See also the live data on TOKYO GAMES's tracker page for current rating, reviews and snapshot timeline.
Building something similar? Get a free AI audit with $-revenue forecasts for every recommendation.
 Fancy Snail Dress Up Game
 Fashion Hair Salon Casual Game
 Bottle Shoot
 My Talking Giraffe
 AS Lottery Numbers