Tools to highlight, edit and capture maps.
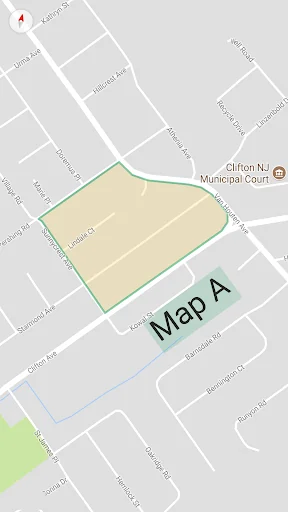
The maps from Google Maps are shown in full screen mode or immersive mode without any object to interfere.
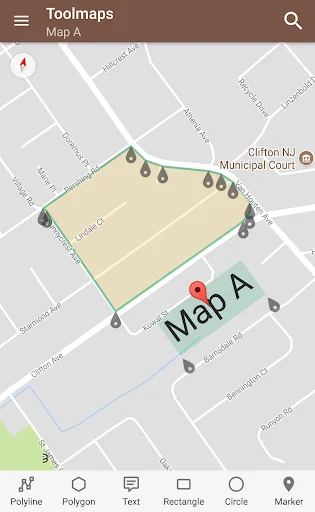
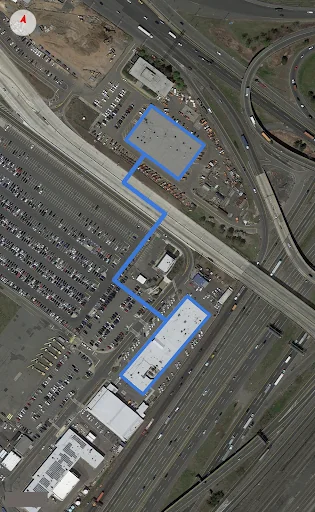
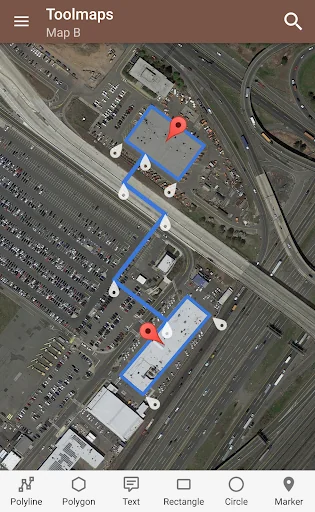
You can add and edit polylines, polygons, rectangles, circles and markers.
You can also add text with colors, resize and rotate them
All colors support transparency.
Others features:
• calculate perimeters and areas of polygons
• calculate distance between two points
• import / export to kml format
• easy command to take a snapshot o…
The maps from Google Maps are shown in full screen mode or immersive mode without any object to interfere.
You can add and edit polylines, polygons, rectangles, circles and markers.
You can also add text with colors, resize and rotate them
All colors support transparency.
Others features:
• calculate perimeters and areas of polygons
• calculate distance between two points
• import / export to kml format
• easy command to take a snapshot of the map using the entire screen
• address search function
• support all the gesture from google maps
• from the navigation drawer easy switch from different map mode: normal, satellite, hybrid, terrain
• options to enabled compass, buildings, traffic, indoor
• one touch to enter / leave fullscreen mode
• support immersive mode for Android 4.4 devices or superior
Comparable Android apps
The five apps in Maps & Navigation with the closest revenue to Toolmaps. Click any to see its detail page.
Each forecast combines App Store rating, ratings count, monetisation model, pricing tier, IAP signals and ad-supported flag.
The base estimate is then multiplied by a per-category scaling factor learned from apps with founder-verified MRR.
Every number on this page comes from public APIs and bumetric's own snapshot history.
Full methodology covers input variables, accuracy bands per category and how we treat apps without comparable anchors.
See also the live data on Toolmaps's tracker page for current rating, reviews and snapshot timeline.
Building something similar? Get a free AI audit with $-revenue forecasts for every recommendation.

 Scania Fleet
 Cuándo SUBO
 Earthquakes
 MKE Park
 Dopravný servis Rádia Expres